


If a cassette company were to make 1000 CD’s, how many of each type would make?
(a) Semi classical = 20, classical = 10, folk = 40, light = 30
(b) Semi classical = 200, classical = 100, folk = 300, light = 400
(c) Semi classical = 300, classical = 200, folk = 400, light = 800
(d) Semi classical = 100, classical = 50, folk = 150, light = 200
Answer
578.1k+ views
Hint: To solve this question, we will calculate the amount of CD of each type separately and that can be calculated by using the given percentage of all multiplied by the total number of CDs that is 1000. By this method, we will separately calculate all the values to get the answer.
Complete step by step answer:
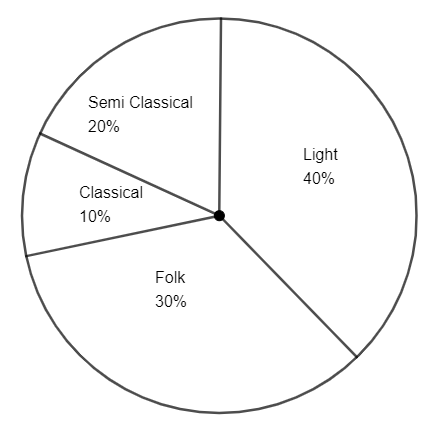
We are given the total number of CDs as 1000. And the pie chart is given as

Let us first calculate the number of CDs in the category light. We are given by the Pie chart that 40% of them are in the category light.
So, 40% of 1000 = Light CDs
\[\Rightarrow \text{Number of light CDs}=\dfrac{40}{100}\times 1000\]
\[\therefore \text{Number of light CDs}=400\]
Therefore, the number of Light CDs is 400.
Now let us calculate for folk. By observing the pie chart we have 30% of the total CDs have a folk type.
So, 30% of 1000 = Folk CDs
\[\Rightarrow \text{Number of Folk CDs}=\dfrac{30}{100}\times 1000\]
\[\therefore \text{Number of Folk CDs}=300\]
Therefore, the number of Folk CDs is 300.
Similarly, let us calculate the number of CDs of Classical. By the pie chart, we have 10% of the total are in Classical type.
So, 10% of 1000 = Classical CDs
\[\Rightarrow \text{Number of Classical CDs}=\dfrac{10}{100}\times 1000\]
\[\therefore \text{Number of Classical CDs}=100\]
Therefore, the number of Classical CDs is 100.
Similarly, let us calculate the number of CDs of Semi Classical. By the pie chart, we have 20% of the total are in Semi Classical type.
So, 20% of 1000 = Semi Classical CDs
\[\Rightarrow \text{Number of Semi Classical CDs}=\dfrac{20}{100}\times 1000\]
\[\therefore \text{Number of Semi Classical CDs}=200\]
Therefore, the number of Semi Classical CDs is 200.
Therefore, we have,
Semi Classical = 200
Classical = 100
Folk = 300
Light = 400
Hence, option (b) is the right answer.
Note:
This is the method when we need to determine the number of elements that are given in the percentage in the pie chart. The Pie chart is defined as a graph that displays the data in circular graphs. The pieces of the graph are proportional to the fraction of the whole in each category.
Complete step by step answer:
We are given the total number of CDs as 1000. And the pie chart is given as
Let us first calculate the number of CDs in the category light. We are given by the Pie chart that 40% of them are in the category light.
So, 40% of 1000 = Light CDs
\[\Rightarrow \text{Number of light CDs}=\dfrac{40}{100}\times 1000\]
\[\therefore \text{Number of light CDs}=400\]
Therefore, the number of Light CDs is 400.
Now let us calculate for folk. By observing the pie chart we have 30% of the total CDs have a folk type.
So, 30% of 1000 = Folk CDs
\[\Rightarrow \text{Number of Folk CDs}=\dfrac{30}{100}\times 1000\]
\[\therefore \text{Number of Folk CDs}=300\]
Therefore, the number of Folk CDs is 300.
Similarly, let us calculate the number of CDs of Classical. By the pie chart, we have 10% of the total are in Classical type.
So, 10% of 1000 = Classical CDs
\[\Rightarrow \text{Number of Classical CDs}=\dfrac{10}{100}\times 1000\]
\[\therefore \text{Number of Classical CDs}=100\]
Therefore, the number of Classical CDs is 100.
Similarly, let us calculate the number of CDs of Semi Classical. By the pie chart, we have 20% of the total are in Semi Classical type.
So, 20% of 1000 = Semi Classical CDs
\[\Rightarrow \text{Number of Semi Classical CDs}=\dfrac{20}{100}\times 1000\]
\[\therefore \text{Number of Semi Classical CDs}=200\]
Therefore, the number of Semi Classical CDs is 200.
Therefore, we have,
Semi Classical = 200
Classical = 100
Folk = 300
Light = 400
Hence, option (b) is the right answer.
Note:
This is the method when we need to determine the number of elements that are given in the percentage in the pie chart. The Pie chart is defined as a graph that displays the data in circular graphs. The pieces of the graph are proportional to the fraction of the whole in each category.
Recently Updated Pages
Master Class 11 Computer Science: Engaging Questions & Answers for Success
Master Class 11 Business Studies: Engaging Questions & Answers for Success
Master Class 11 Economics: Engaging Questions & Answers for Success
Master Class 11 English: Engaging Questions & Answers for Success
Master Class 11 Maths: Engaging Questions & Answers for Success
Master Class 11 Biology: Engaging Questions & Answers for Success
Trending doubts
One Metric ton is equal to kg A 10000 B 1000 C 100 class 11 physics CBSE
There are 720 permutations of the digits 1 2 3 4 5 class 11 maths CBSE
Discuss the various forms of bacteria class 11 biology CBSE
Draw a diagram of a plant cell and label at least eight class 11 biology CBSE
State the laws of reflection of light
Explain zero factorial class 11 maths CBSE