


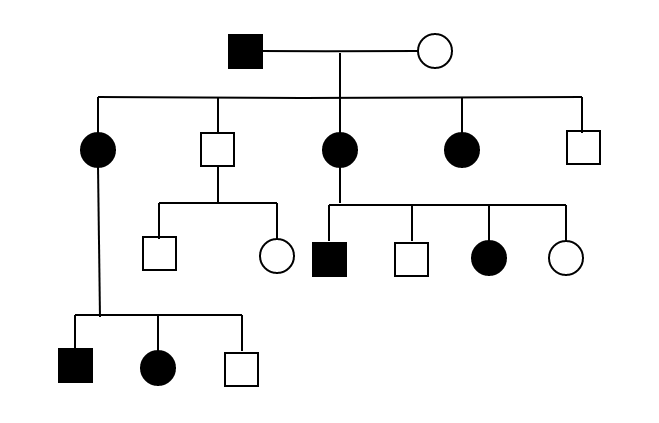
Identify the type of inheritance shown in the diagram.
a. dominant X-linked
b. recessive X-linked
c. dominant Y-linked
d. recessive Y-linked
Answer
609.3k+ views
Hint: A pedigree analysis is a family tree or chart made of symbols and lines that represent a person's genetic family history. In this system, the symbols represent people and lines represent genetic relationships. It is a visual tool for documenting the biological relationship in families and determining the mode of inheritance (dominant or recessive) of genetic diseases. There can be a sex-linked dominant inheritance or recessive inheritance.
Complete answer:
In the pedigree analysis, We have two shapes in which the squares represent males and the circles represent females.
• Horizontal lines that connect a male and female stand for mating between the two.
• Vertical lines that extend downward from a couple represent their offspring.
• Consecutive generations are therefore written underneath the parental generations and the top position is acquired by the oldest individual.
• Based on information in a pedigree, geneticists try to determine the mode of inheritance of a straight.
Expected patterns that various types of inheritance in pedigrees always follow are as under–
• Autosomal recessive inheritance.
• Autosomal dominant inheritance.
• Sex-linked (X linked) recessive inheritance.
• Sex-linked (X linked) dominant inheritance.
• Y linked inheritance.
The above diagram shows the X-linked dominant inheritance. The main points include-
• The trait never skips generations.
• Affected mothers give rise to affected males.
• Affected mothers or fathers give rise to affected females.
• No son is affected but all the daughters are affected.
• In the above diagram, all the daughters are affected and the affected males came from affected mothers.
Hence, the correct answer is option (A).
Additional information:
The examples of Autosomal and X linked genetic disorders are as follows-
• Autosomal dominant - Marfan syndrome, Huntington’s chorea.
• Autosomal recessive - Sickle cell Anemia, Cystic fibrosis.
• Sex-linked recessive- Haemophilia A&B, Colorblindness.
• Sex-linked dominant- Vitamin D resistant rickets.
Note: The pedigree analysis represents the family chart and these are then visualized or studied in order to estimate the mode of inheritance. The shapes represent the gender of different individuals. The square shape is for males and the circle is for females. The colored and non-colored shapes represent the occurrence of a genetic disorder.
Recently Updated Pages
Master Class 12 Business Studies: Engaging Questions & Answers for Success
Master Class 12 Chemistry: Engaging Questions & Answers for Success
Master Class 12 Biology: Engaging Questions & Answers for Success
Class 12 Question and Answer - Your Ultimate Solutions Guide
Master Class 11 English: Engaging Questions & Answers for Success
Master Class 11 Social Science: Engaging Questions & Answers for Success
Trending doubts
Which are the Top 10 Largest Countries of the World?
Draw a labelled sketch of the human eye class 12 physics CBSE
The end of compass needle which points towards north class 12 physics CBSE
Differentiate between homogeneous and heterogeneous class 12 chemistry CBSE
Why is the cell called the structural and functional class 12 biology CBSE
When was the first election held in India a 194748 class 12 sst CBSE