


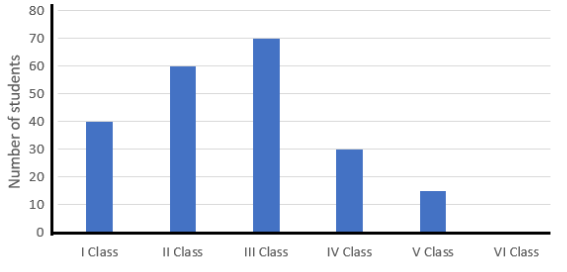
Identify the scale used on the axes of the adjacent graph. Write the frequency distribution from it.
Answer
643.8k+ views
Hint: Observe that the given graph is a bar graph and not a histogram. Observe that in the y-axis a marking is done every 1cm and an increment of 10 units is done. Hence determine the scale of the y-axis. Use the fact that the frequency of an object in a category is the number of the occurrence of the object in that category and the frequency distribution is the table mapping category with the frequency of that category and can have up to two columns of frequency, the absolute frequency and the relative frequency. From the above graph draw the frequency distribution table of the number of students in each class.
Before solving the question, we need to understand what type is above the graph of.
Since there are no ranges and only categories along the x-axis and the rectangles are used to denote the frequency, the above graph is a bar graph.
Since for every 1cm along the y-axis, there is an increment of 10 students along the y-axis the scale of the graph is 10 students/cm.
Frequency of an object in a category is the number of the occurrence of the object in that category.
Now there are six categories in the above graph viz, I Class, II Class, III Class, IV Class, V Class and VI Class.
The frequency of the number of students for category I Class is 40
The frequency of the number of students for category II Class is 60
The frequency of the number of students for category I Class is 70
The frequency of the number of students for category IV Class is 30
The frequency of the number of students for category V Class is 15
The frequency of the number of students for category VI Class is 0
Hence the frequency distribution table of the above chart is
Note: We can also add another column for relative frequency which is the ratio of the category frequency to the total sum of frequencies multiplied by 100. The frequency table containing relative frequency for the above table is shown below
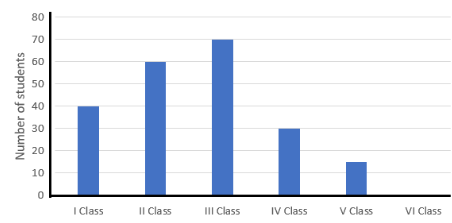
Before solving the question, we need to understand what type is above the graph of.
Since there are no ranges and only categories along the x-axis and the rectangles are used to denote the frequency, the above graph is a bar graph.
Since for every 1cm along the y-axis, there is an increment of 10 students along the y-axis the scale of the graph is 10 students/cm.
Frequency of an object in a category is the number of the occurrence of the object in that category.
Now there are six categories in the above graph viz, I Class, II Class, III Class, IV Class, V Class and VI Class.
The frequency of the number of students for category I Class is 40
The frequency of the number of students for category II Class is 60
The frequency of the number of students for category I Class is 70
The frequency of the number of students for category IV Class is 30
The frequency of the number of students for category V Class is 15
The frequency of the number of students for category VI Class is 0
Hence the frequency distribution table of the above chart is
| Category | Frequency |
| I class | 40 |
| II class | 60 |
| III class | 70 |
| IV class | 30 |
| V class | 15 |
| VI class | 0 |
Note: We can also add another column for relative frequency which is the ratio of the category frequency to the total sum of frequencies multiplied by 100. The frequency table containing relative frequency for the above table is shown below
| Category | Frequency | Relative frequency |
| I class | 40 | 18.60 |
| II class | 60 | 27.90 |
| III class | 70 | 32.55 |
| IV class | 30 | 13.95 |
| V class | 15 | 6.97 |
| VI class | 0 | 0 |
Recently Updated Pages
Master Class 11 English: Engaging Questions & Answers for Success
Master Class 11 Social Science: Engaging Questions & Answers for Success
Master Class 11 Maths: Engaging Questions & Answers for Success
Master Class 11 Biology: Engaging Questions & Answers for Success
Master Class 11 Physics: Engaging Questions & Answers for Success
Master Class 11 Chemistry: Engaging Questions & Answers for Success
Trending doubts
In Indian rupees 1 trillion is equal to how many c class 8 maths CBSE
What is BLO What is the full form of BLO class 8 social science CBSE
What are the 12 elements of nature class 8 chemistry CBSE
Citizens of India can vote at the age of A 18 years class 8 social science CBSE
Which of the following leader has given the term insensate class 8 social science CBSE
Name the states through which the Tropic of Cancer class 8 social science CBSE