


How will you graph \[f(x) = - (x - 2)(x + 5)\]?
Answer
545.4k+ views
Hint:
There are various tools that can be used for graphing a function. Since we can determine it’s a polynomial because there are two first degree terms and after multiplication we will find that only \[{x^2}\] will be the highest term. The major finding is that as it is second degree either it will be convex or concave parabola. So graph the parabola by the use of direction, focus, vertex and axis of symmetry.
Complete step by step solution:
Firstly as we have determined that is a polynomial and second degree so the resulting graph could be convex or concave parabola which depends by the sign of coefficient of \[{x^2}\]. We will check whether there is a positive or negative sign before \[{x^2}\].
It is determined that coefficient will be \[ - 1\] which reflects it to be a convex parabola.
Further we will factorize the equation and can see what zeroes are
\[x - 2 = 0\] Or \[x + 5 = 0\]
Therefore \[x \in \{ - 5,2)\]
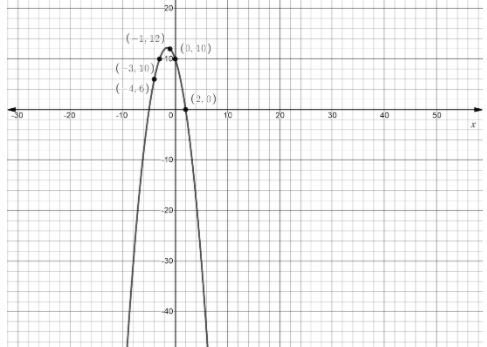
Now we will plot the function after calculating all the information
\[
x = - 4,y = 6 \\
x = - 3,y = 10 \\
x = - 1,y = 12 \\
x = 0,y = 10 \\
x = 1,y = 6 \\
x = 2,y = 0 \\
\]
So the graph sketched is as followed for \[\left\{ { - \left( {x - 2} \right)\left( {x + 5} \right)[ - 8,8, - 10,20]} \right\}\]
Formula:
A polynomial function of degree 2 is known as quadratic function and in a general form it can be written as \[f(x) = a{x^2} + bx + c\] in which \[a,b\]and c represents real numbers ad and squaring function\[f(x) = {x^2}\]. Here we will determine the points after factorization and plot a graph.
Additional information:
While sketching a graph only three points can determine a parabola but for better approximation of general shape it is suggested to find up to five points.
Note:
Here in the above equation while plotting the function we found that function goes up to\[x = - 5\]. Later on we can see that it makes out in between falling down through \[x = 2\]and then down to infinity at last. Remember that graph is indeed a function as it passes the vertical line test and the domain of the function is composed of all the real numbers \[( - \infty ,\infty )\] while range has a set of non-negative numbers \[(0,\infty )\].
There are various tools that can be used for graphing a function. Since we can determine it’s a polynomial because there are two first degree terms and after multiplication we will find that only \[{x^2}\] will be the highest term. The major finding is that as it is second degree either it will be convex or concave parabola. So graph the parabola by the use of direction, focus, vertex and axis of symmetry.
Complete step by step solution:
Firstly as we have determined that is a polynomial and second degree so the resulting graph could be convex or concave parabola which depends by the sign of coefficient of \[{x^2}\]. We will check whether there is a positive or negative sign before \[{x^2}\].
It is determined that coefficient will be \[ - 1\] which reflects it to be a convex parabola.
Further we will factorize the equation and can see what zeroes are
\[x - 2 = 0\] Or \[x + 5 = 0\]
Therefore \[x \in \{ - 5,2)\]
Now we will plot the function after calculating all the information
\[
x = - 4,y = 6 \\
x = - 3,y = 10 \\
x = - 1,y = 12 \\
x = 0,y = 10 \\
x = 1,y = 6 \\
x = 2,y = 0 \\
\]
So the graph sketched is as followed for \[\left\{ { - \left( {x - 2} \right)\left( {x + 5} \right)[ - 8,8, - 10,20]} \right\}\]
Formula:
A polynomial function of degree 2 is known as quadratic function and in a general form it can be written as \[f(x) = a{x^2} + bx + c\] in which \[a,b\]and c represents real numbers ad and squaring function\[f(x) = {x^2}\]. Here we will determine the points after factorization and plot a graph.
Additional information:
While sketching a graph only three points can determine a parabola but for better approximation of general shape it is suggested to find up to five points.
Note:
Here in the above equation while plotting the function we found that function goes up to\[x = - 5\]. Later on we can see that it makes out in between falling down through \[x = 2\]and then down to infinity at last. Remember that graph is indeed a function as it passes the vertical line test and the domain of the function is composed of all the real numbers \[( - \infty ,\infty )\] while range has a set of non-negative numbers \[(0,\infty )\].
Recently Updated Pages
Master Class 11 Business Studies: Engaging Questions & Answers for Success
Master Class 11 Economics: Engaging Questions & Answers for Success
Master Class 11 Computer Science: Engaging Questions & Answers for Success
Master Class 11 English: Engaging Questions & Answers for Success
Master Class 11 Maths: Engaging Questions & Answers for Success
Master Class 11 Biology: Engaging Questions & Answers for Success
Trending doubts
One Metric ton is equal to kg A 10000 B 1000 C 100 class 11 physics CBSE
Discuss the various forms of bacteria class 11 biology CBSE
Draw a diagram of a plant cell and label at least eight class 11 biology CBSE
State the laws of reflection of light
Explain zero factorial class 11 maths CBSE
10 examples of friction in our daily life