


How many runs did Sachin score? In \[\% \]
Answer
578.1k+ views
Hint: Here, we will analyze the given pie chart to find the runs scored by Sachin and then we will add the total runs scored during the cricket match. Then we will find the percentage by dividing the runs scored by Sachin with total runs scored and multiply it with 100.
Complete step-by-step answer:
Here, we will form a table with names and the runs scored by them.
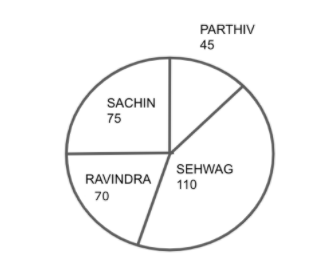
First, we will analyze the given pie chart to find the runs scored by Sachin, we have
\[ \Rightarrow {\text{Runs scored by Sachin}} = 75\]
Now we will add the total runs scored during the cricket match, we get
\[
\Rightarrow 45 + 75 + 70 + 110 \\
\Rightarrow 300 \\
\]
Then we will find percentage by dividing the runs scored by Sachin with total runs scored and multiply it with 100, we get
\[
\Rightarrow \dfrac{{75}}{{300}} \times 100 \\
\Rightarrow 25\% \\
\]
Therefore, the runs scored by Sachin from the given pie chart has \[25\% \].
Note: In solving these types of questions, we should be familiar that a Pie Chart is a type of graph that displays data in a circular graph. The pieces of the graph are proportional to the fraction of the whole in each category. In other words, each slice of the pie is relative to the size of that category in the group as a whole. The entire “pie” represents 100 percent of a whole, while the pie “slices” represent portions of the whole.
Complete step-by-step answer:
Here, we will form a table with names and the runs scored by them.
| Name | Scored Runs |
| Parthiv | 45 |
| Sachin | 75 |
| Ravindra | 70 |
| Sehwag | 110 |
First, we will analyze the given pie chart to find the runs scored by Sachin, we have
\[ \Rightarrow {\text{Runs scored by Sachin}} = 75\]
Now we will add the total runs scored during the cricket match, we get
\[
\Rightarrow 45 + 75 + 70 + 110 \\
\Rightarrow 300 \\
\]
Then we will find percentage by dividing the runs scored by Sachin with total runs scored and multiply it with 100, we get
\[
\Rightarrow \dfrac{{75}}{{300}} \times 100 \\
\Rightarrow 25\% \\
\]
Therefore, the runs scored by Sachin from the given pie chart has \[25\% \].
Note: In solving these types of questions, we should be familiar that a Pie Chart is a type of graph that displays data in a circular graph. The pieces of the graph are proportional to the fraction of the whole in each category. In other words, each slice of the pie is relative to the size of that category in the group as a whole. The entire “pie” represents 100 percent of a whole, while the pie “slices” represent portions of the whole.
Recently Updated Pages
Master Class 10 Computer Science: Engaging Questions & Answers for Success
Master Class 10 General Knowledge: Engaging Questions & Answers for Success
Master Class 10 English: Engaging Questions & Answers for Success
Master Class 10 Social Science: Engaging Questions & Answers for Success
Master Class 10 Maths: Engaging Questions & Answers for Success
Master Class 10 Science: Engaging Questions & Answers for Success
Trending doubts
What is the median of the first 10 natural numbers class 10 maths CBSE
The draft of the Preamble of the Indian Constitution class 10 social science CBSE
Which women's tennis player has 24 Grand Slam singles titles?
Who gave "Inqilab Zindabad" slogan?
Why is there a time difference of about 5 hours between class 10 social science CBSE
Who is the Brand Ambassador of Incredible India?