


How do you solve \[y = 2x - {x^2}\] graphically?
Answer
572.4k+ views
Hint: We know that the given equation is of parabola. So we know how to plot it but here the case is we need to plot the given function anything it is graphically. So we will take different values of x and by putting that value in the equation we will find the values of y. This will be repeated and we will get at least four such pairs. And then we will plot the graph of the equation so given.
Complete step-by-step answer:
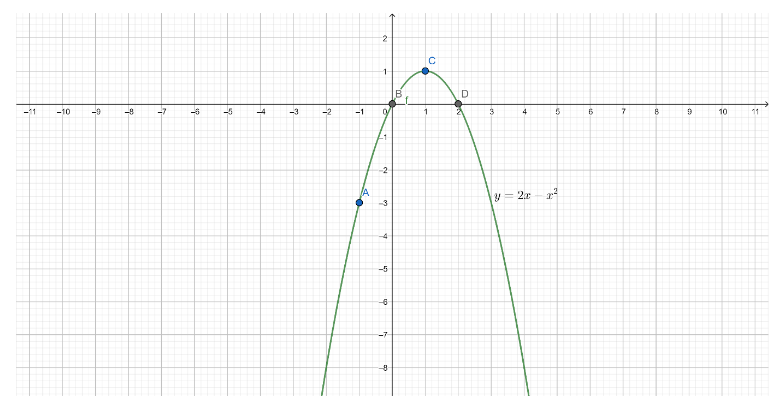
Given that equation to be plotted is,
\[y = 2x - {x^2}\]
Now we will take this equation as \[f\left( x \right) = y = 2x - {x^2}\]
Now we will find the value of function for different values of x.
x=-1
\[f\left( { - 1} \right) = 2\left( { - 1} \right) - {\left( { - 1} \right)^2} = - 2 - 1 = - 3\]
That is the value of y is -3.
x=0
\[f\left( 0 \right) = 2\left( 0 \right) - {\left( 0 \right)^2} = 0\]
That is the value of y is 0.
x=1
\[f\left( 1 \right) = 2\left( 1 \right) - {\left( 1 \right)^2} = 2 - 1 = 1\]
That is the value of y is 1.
x=2
\[f\left( 2 \right) = 2\left( 2 \right) - {\left( 2 \right)^2} = 4 - 4 = 0\]
That is the value of y is 0.
Now the pairs \[\left( { - 1, - 3} \right),\left( {0,0} \right),\left( {1,1} \right)\& \left( {2,0} \right)\] are to be plotted on the graph so that it will be the graphical solution.
Note: Here note that if the question is not mentioned with the method to be followed we will need to find the vertex, focus, directrix and other such parameters related to the parabolic equation. and need to know which opening parabola is that.
Complete step-by-step answer:
Given that equation to be plotted is,
\[y = 2x - {x^2}\]
Now we will take this equation as \[f\left( x \right) = y = 2x - {x^2}\]
Now we will find the value of function for different values of x.
x=-1
\[f\left( { - 1} \right) = 2\left( { - 1} \right) - {\left( { - 1} \right)^2} = - 2 - 1 = - 3\]
That is the value of y is -3.
x=0
\[f\left( 0 \right) = 2\left( 0 \right) - {\left( 0 \right)^2} = 0\]
That is the value of y is 0.
x=1
\[f\left( 1 \right) = 2\left( 1 \right) - {\left( 1 \right)^2} = 2 - 1 = 1\]
That is the value of y is 1.
x=2
\[f\left( 2 \right) = 2\left( 2 \right) - {\left( 2 \right)^2} = 4 - 4 = 0\]
That is the value of y is 0.
Now the pairs \[\left( { - 1, - 3} \right),\left( {0,0} \right),\left( {1,1} \right)\& \left( {2,0} \right)\] are to be plotted on the graph so that it will be the graphical solution.
Note: Here note that if the question is not mentioned with the method to be followed we will need to find the vertex, focus, directrix and other such parameters related to the parabolic equation. and need to know which opening parabola is that.
Recently Updated Pages
Master Class 11 English: Engaging Questions & Answers for Success
Master Class 11 Social Science: Engaging Questions & Answers for Success
Master Class 11 Maths: Engaging Questions & Answers for Success
Master Class 11 Biology: Engaging Questions & Answers for Success
Master Class 11 Physics: Engaging Questions & Answers for Success
Master Class 11 Chemistry: Engaging Questions & Answers for Success
Trending doubts
In Indian rupees 1 trillion is equal to how many c class 8 maths CBSE
What is BLO What is the full form of BLO class 8 social science CBSE
What helps Frog to breathe underwater class 8 biology CBSE
Citizens of India can vote at the age of A 18 years class 8 social science CBSE
Which of the following leader has given the term insensate class 8 social science CBSE
Name the states through which the Tropic of Cancer class 8 social science CBSE