


How do you plot $ ( - 2,8)? $
Answer
556.5k+ views
Hint: we can plot a point on a graph by using measurement on $ X $ coordinate and $ Y $ coordinate of the graph. Measurement plan on a graph taking $ 1 $ cm in $ X $ axis as $ 1 $ units and also $ 1 $ cm in $ Y $ axis as $ 1 $ units. And then marked the coordinates.
Complete Step by Step Solution:
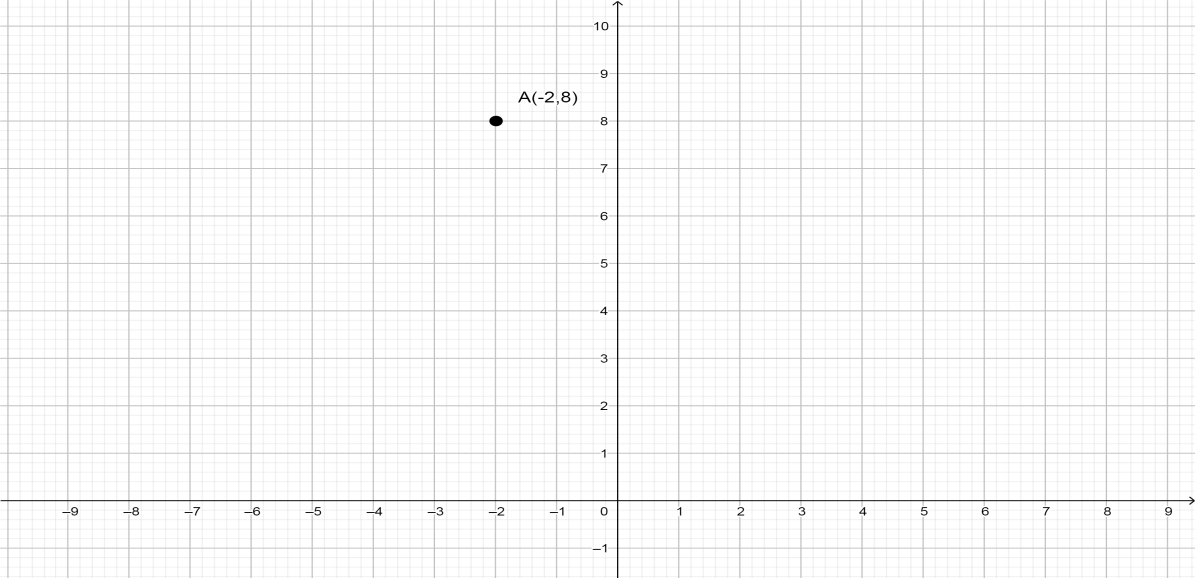
Now, given coordinate is $ ( - 2,8) $
$ - 2 $ is our $ X $ coordinate on the graph and the $ 8 $ is our $ Y $ coordinate on the graph.
Taking the $ X $ axis is the horizontal side of a graph and the $ Y $ axis is the vertical side of a graph.
Marked the origin point $ (0,0) $ . And then taking $ 1 $ cm in $ X $ axis as $ 1 $ units and also $ 1 $ cm in $ Y $ axis as $ 1 $ units. From the Origin right side of the $ X $ axis having positive number of units and left side of the $ X $ axis having negative number of units.
Similarly, in the $ Y $ axis, the upper side of the origin having positive number of units and lower side of the origin having negative number of units.
Now marked the number $ - 2 $ in $ X $ axis. It is a negative number so it takes a place on the left side of the origin and then moves from that same position marked the number $ 8 $ vertically in the $ Y $ axis. It is a positive number so it takes a place in the upper side of the origin.
Now we will be $ - 2 $ ticks left on the $ X $ axis and $ 8 $ ticks up on the $ Y $ axis.
The graph of the plot,
Note: To plot a point we need to have two things one is a point and another one is a coordinate plane.
A point in a plane contains two components where order matters.
A point comes in the form $ (x,y) $ where $ x $ comes first and $ y $ comes second.
A coordinate plane is composed of two lines intersecting at a $ 90 $ degree angle at the point $ (0,0) $ known as the origin
Complete Step by Step Solution:
Now, given coordinate is $ ( - 2,8) $
$ - 2 $ is our $ X $ coordinate on the graph and the $ 8 $ is our $ Y $ coordinate on the graph.
Taking the $ X $ axis is the horizontal side of a graph and the $ Y $ axis is the vertical side of a graph.
Marked the origin point $ (0,0) $ . And then taking $ 1 $ cm in $ X $ axis as $ 1 $ units and also $ 1 $ cm in $ Y $ axis as $ 1 $ units. From the Origin right side of the $ X $ axis having positive number of units and left side of the $ X $ axis having negative number of units.
Similarly, in the $ Y $ axis, the upper side of the origin having positive number of units and lower side of the origin having negative number of units.
Now marked the number $ - 2 $ in $ X $ axis. It is a negative number so it takes a place on the left side of the origin and then moves from that same position marked the number $ 8 $ vertically in the $ Y $ axis. It is a positive number so it takes a place in the upper side of the origin.
Now we will be $ - 2 $ ticks left on the $ X $ axis and $ 8 $ ticks up on the $ Y $ axis.
The graph of the plot,
Note: To plot a point we need to have two things one is a point and another one is a coordinate plane.
A point in a plane contains two components where order matters.
A point comes in the form $ (x,y) $ where $ x $ comes first and $ y $ comes second.
A coordinate plane is composed of two lines intersecting at a $ 90 $ degree angle at the point $ (0,0) $ known as the origin
Recently Updated Pages
Master Class 11 Computer Science: Engaging Questions & Answers for Success
Master Class 11 Business Studies: Engaging Questions & Answers for Success
Master Class 11 Economics: Engaging Questions & Answers for Success
Master Class 11 English: Engaging Questions & Answers for Success
Master Class 11 Maths: Engaging Questions & Answers for Success
Master Class 11 Biology: Engaging Questions & Answers for Success
Trending doubts
One Metric ton is equal to kg A 10000 B 1000 C 100 class 11 physics CBSE
There are 720 permutations of the digits 1 2 3 4 5 class 11 maths CBSE
Discuss the various forms of bacteria class 11 biology CBSE
Draw a diagram of a plant cell and label at least eight class 11 biology CBSE
State the laws of reflection of light
Explain zero factorial class 11 maths CBSE