


How do you graph$y = \dfrac{1}{{x + 3}}$?
Answer
585.6k+ views
Hint:In order to draw the graph of the above rational function we have to first find the asymptotes of the rational function, by setting denominator equal to 0 to find the vertical asymptote and for the horizontal asymptote find the limit approach to $\infty $for the function .The graph to the equation will be a rectangular hyperbola made about these asymptotes.
Complete step by step solution:
We are given an rational function of the form $R(x) = \dfrac{{a{x^n}}}{{b{x^m}}}$ , here we are having variable $x$and $y$telling $y = \dfrac{1}{{x + 3}}$
Vertical asymptotes for rational functions are found by setting the denominator equivalent to 0. This additionally assists with finding the domain.
The domain can NOT contain that number! For this function,
$
x + 3 \ne 0 \\
x \ne - 3 \\
$
y is defined for $x \in ( - \infty , - 3) \cup ( - 3, + \infty )$
so $x = - 3$ is the condition of the vertical asymptote, and 0 should be avoided with regard to the domain: $x \in ( - \infty , - 3) \cup ( - 3, + \infty )$
Horizontal asymptotes are found by subbing in huge positive and negative qualities into the
function. $f(1000)$ or $f(1000000)$can assist with figuring out where the function "closes" are going.
For this situation, $\dfrac{1}{{1000 + 3}}\,or\,\dfrac{1}{{1000000 + 3}}$
will get very near 0. (this is known as a limit)
$\mathop {\lim }\limits_{x \to \infty } y = 0$
Therefore, our horizontal asymptote will be at $y = 0$.
The graph to the equation y is a rectangular hyperbola about the vertical and horizontal asymptotes.
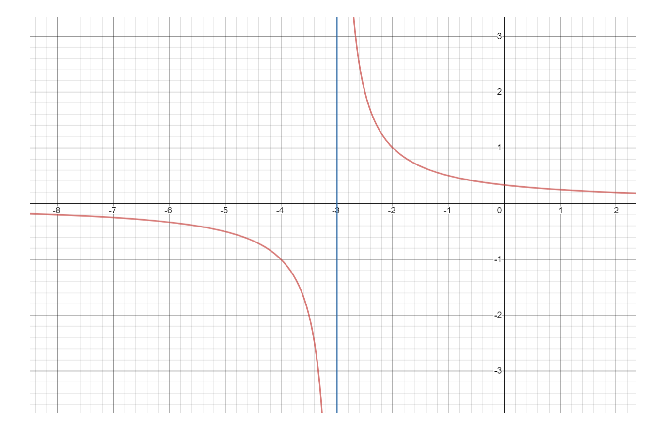
Hence we’ve successfully plotted our graph of $y = \dfrac{1}{{x + 3}}$.
Additional Information:
Cartesian Plane: A Cartesian Plane is given its name by the French mathematician Rene Descartes ,who first used this plane in the field of mathematics .It is defined as the two mutually perpendicular the number line , the one which is horizontal is given the name x-axis and the one which is vertical is known as y-axis. With the help of these axis we can plot any point on this cartesian plane with the help of an ordered pair of numbers.
Note:1.Draw the cartesian plane only with the help of a straight ruler and pencil to get the perfect and accurate results.
2.You can take any two points from the equation to plot the graph to the equation
Complete step by step solution:
We are given an rational function of the form $R(x) = \dfrac{{a{x^n}}}{{b{x^m}}}$ , here we are having variable $x$and $y$telling $y = \dfrac{1}{{x + 3}}$
Vertical asymptotes for rational functions are found by setting the denominator equivalent to 0. This additionally assists with finding the domain.
The domain can NOT contain that number! For this function,
$
x + 3 \ne 0 \\
x \ne - 3 \\
$
y is defined for $x \in ( - \infty , - 3) \cup ( - 3, + \infty )$
so $x = - 3$ is the condition of the vertical asymptote, and 0 should be avoided with regard to the domain: $x \in ( - \infty , - 3) \cup ( - 3, + \infty )$
Horizontal asymptotes are found by subbing in huge positive and negative qualities into the
function. $f(1000)$ or $f(1000000)$can assist with figuring out where the function "closes" are going.
For this situation, $\dfrac{1}{{1000 + 3}}\,or\,\dfrac{1}{{1000000 + 3}}$
will get very near 0. (this is known as a limit)
$\mathop {\lim }\limits_{x \to \infty } y = 0$
Therefore, our horizontal asymptote will be at $y = 0$.
The graph to the equation y is a rectangular hyperbola about the vertical and horizontal asymptotes.
Hence we’ve successfully plotted our graph of $y = \dfrac{1}{{x + 3}}$.
Additional Information:
Cartesian Plane: A Cartesian Plane is given its name by the French mathematician Rene Descartes ,who first used this plane in the field of mathematics .It is defined as the two mutually perpendicular the number line , the one which is horizontal is given the name x-axis and the one which is vertical is known as y-axis. With the help of these axis we can plot any point on this cartesian plane with the help of an ordered pair of numbers.
Note:1.Draw the cartesian plane only with the help of a straight ruler and pencil to get the perfect and accurate results.
2.You can take any two points from the equation to plot the graph to the equation
Recently Updated Pages
Master Class 11 Social Science: Engaging Questions & Answers for Success
Master Class 11 English: Engaging Questions & Answers for Success
Master Class 11 Maths: Engaging Questions & Answers for Success
Master Class 11 Chemistry: Engaging Questions & Answers for Success
Master Class 11 Biology: Engaging Questions & Answers for Success
Master Class 11 Physics: Engaging Questions & Answers for Success
Trending doubts
One Metric ton is equal to kg A 10000 B 1000 C 100 class 11 physics CBSE
Difference Between Prokaryotic Cells and Eukaryotic Cells
How many of the following diseases can be studied with class 11 biology CBSE
Which of the following enzymes is used for carboxylation class 11 biology CBSE
Draw a diagram of a plant cell and label at least eight class 11 biology CBSE
Two of the body parts which do not appear in MRI are class 11 biology CBSE