


How do you graph \[y={{x}^{2}}+6x+9\]?
Answer
606k+ views
Hint: This type of question is based on the concept of plotting graphs for the quadratic equation. We have to first consider the given function and simplify the given function as much as possible. Since \[{{\left( x+3 \right)}^{2}}={{x}^{2}}+6x+9\], we can simplify the given function as \[y={{\left( x+3 \right)}^{2}}\]. Now, find the value of x when y=0 and find the value of y when x=0. Also consider a few points for x and substitute it in the obtained equation to find the corresponding value of y. Then, draw a table and mention the points x and y. plot the graph using this table.
Complete step-by-step solution:
According to the question, we are asked to plot a graph for \[y={{x}^{2}}+6x+9\].
We have been given the function \[y={{x}^{2}}+6x+9\]. ----------(1)
First, we have to consider the equation (1).
Simplify the equation (1) with known formulas.
Here, \[y={{x}^{2}}+2\times 3x+{{3}^{2}}\]
This is of the form \[{{a}^{2}}+2ab+{{b}^{2}}\], where a=x and b=3.
We know that \[{{\left( a+b \right)}^{2}}={{a}^{2}}+2ab+{{b}^{2}}\].
Therefore, we get \[y={{\left( x+3 \right)}^{2}}\]. --------------(2)
Now, let us consider y=0
We have to find the value of x.
\[{{\left( x+3 \right)}^{2}}=0\]
Taking square root on both the sides of the equation, we get
\[\sqrt{{{\left( x+3 \right)}^{2}}}=\sqrt{0}\]
\[\Rightarrow \sqrt{{{\left( x+3 \right)}^{2}}}=0\]
We know that \[\sqrt{{{a}^{2}}}=a\]. Therefore, we get
\[x+3=0\] [twice]
Subtracting 3 from both the sides of the equation, we get
\[x+3-3=0-3\]
\[\Rightarrow x=-3\] [twice]
Since y is a quadratic equation, the curve crosses the x-axis at x=-3 twice.
Therefore, the point passes through (-3,0) twice.
When x=0, we have to find the value of y using the equation (2).
\[\Rightarrow y={{\left( 0+3 \right)}^{2}}\]
\[\Rightarrow y={{\left( 3 \right)}^{2}}\]
Since square of 3 is 9, we get
\[y=9\]
Therefore, the curve passes through the coordinate (0,9).
Also let x=-1
\[\Rightarrow y={{\left( -1+3 \right)}^{2}}\]
\[\Rightarrow y={{\left( 2 \right)}^{2}}\]
\[\therefore y=4\]
Similarly let x=-2
\[\Rightarrow y={{\left( -2+3 \right)}^{2}}\]
\[\Rightarrow y={{\left( 1 \right)}^{2}}\]
\[\therefore y=1\]
When x=-4
\[\Rightarrow y={{\left( -4+3 \right)}^{2}}\]
\[\Rightarrow y={{\left( -1 \right)}^{2}}\]
\[\therefore y=1\]
Similarly, when x=-5
\[\Rightarrow y={{\left( -5+3 \right)}^{2}}\]
\[\Rightarrow y={{\left( -2 \right)}^{2}}\]
\[\therefore y=4\]
To plot the graph, let us draw a table with points in the curve.
Also we have to note that the quadratic equation will always be parabola.
Let us now plot the graph with the following points.
Therefore, the graph of \[y={{x}^{2}}+6x+9\] is obtained.
Note: We should not simply draw straight lines between the points. Since the given equation is a quadratic equation, the graph will always be a parabola. Since we get the same values of y for different values of x, don’t consider the solution to be wrong. Avoid calculation mistakes while solving the points.
Complete step-by-step solution:
According to the question, we are asked to plot a graph for \[y={{x}^{2}}+6x+9\].
We have been given the function \[y={{x}^{2}}+6x+9\]. ----------(1)
First, we have to consider the equation (1).
Simplify the equation (1) with known formulas.
Here, \[y={{x}^{2}}+2\times 3x+{{3}^{2}}\]
This is of the form \[{{a}^{2}}+2ab+{{b}^{2}}\], where a=x and b=3.
We know that \[{{\left( a+b \right)}^{2}}={{a}^{2}}+2ab+{{b}^{2}}\].
Therefore, we get \[y={{\left( x+3 \right)}^{2}}\]. --------------(2)
Now, let us consider y=0
We have to find the value of x.
\[{{\left( x+3 \right)}^{2}}=0\]
Taking square root on both the sides of the equation, we get
\[\sqrt{{{\left( x+3 \right)}^{2}}}=\sqrt{0}\]
\[\Rightarrow \sqrt{{{\left( x+3 \right)}^{2}}}=0\]
We know that \[\sqrt{{{a}^{2}}}=a\]. Therefore, we get
\[x+3=0\] [twice]
Subtracting 3 from both the sides of the equation, we get
\[x+3-3=0-3\]
\[\Rightarrow x=-3\] [twice]
Since y is a quadratic equation, the curve crosses the x-axis at x=-3 twice.
Therefore, the point passes through (-3,0) twice.
When x=0, we have to find the value of y using the equation (2).
\[\Rightarrow y={{\left( 0+3 \right)}^{2}}\]
\[\Rightarrow y={{\left( 3 \right)}^{2}}\]
Since square of 3 is 9, we get
\[y=9\]
Therefore, the curve passes through the coordinate (0,9).
Also let x=-1
\[\Rightarrow y={{\left( -1+3 \right)}^{2}}\]
\[\Rightarrow y={{\left( 2 \right)}^{2}}\]
\[\therefore y=4\]
Similarly let x=-2
\[\Rightarrow y={{\left( -2+3 \right)}^{2}}\]
\[\Rightarrow y={{\left( 1 \right)}^{2}}\]
\[\therefore y=1\]
When x=-4
\[\Rightarrow y={{\left( -4+3 \right)}^{2}}\]
\[\Rightarrow y={{\left( -1 \right)}^{2}}\]
\[\therefore y=1\]
Similarly, when x=-5
\[\Rightarrow y={{\left( -5+3 \right)}^{2}}\]
\[\Rightarrow y={{\left( -2 \right)}^{2}}\]
\[\therefore y=4\]
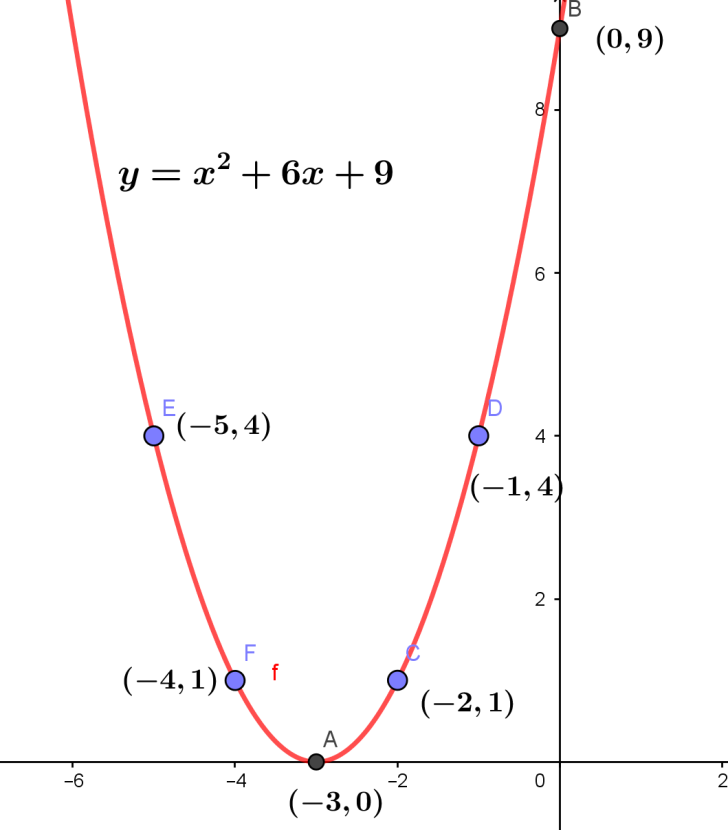
To plot the graph, let us draw a table with points in the curve.
| x | 0 | -1 | -2 | -3 | -4 | -5 |
| y | 9 | 4 | 1 | 0 | 1 | 4 |
Also we have to note that the quadratic equation will always be parabola.
Let us now plot the graph with the following points.
Therefore, the graph of \[y={{x}^{2}}+6x+9\] is obtained.
Note: We should not simply draw straight lines between the points. Since the given equation is a quadratic equation, the graph will always be a parabola. Since we get the same values of y for different values of x, don’t consider the solution to be wrong. Avoid calculation mistakes while solving the points.
Recently Updated Pages
Basicity of sulphurous acid and sulphuric acid are
Master Class 11 English: Engaging Questions & Answers for Success
Master Class 11 Physics: Engaging Questions & Answers for Success
Master Class 11 Computer Science: Engaging Questions & Answers for Success
Master Class 11 Chemistry: Engaging Questions & Answers for Success
Master Class 11 Social Science: Engaging Questions & Answers for Success
Trending doubts
Difference Between Prokaryotic Cells and Eukaryotic Cells
Two of the body parts which do not appear in MRI are class 11 biology CBSE
One Metric ton is equal to kg A 10000 B 1000 C 100 class 11 physics CBSE
10 examples of friction in our daily life
Draw a diagram of nephron and explain its structur class 11 biology CBSE
What will happen if the mucus is not secreted by the class 11 biology CBSE