


How do you graph $y=\sqrt{x}+5$?
Answer
543.3k+ views
Hint: To draw a graph of the given equation first we need to find the domain and range of the given equation. Domain is the input of a function and range is the output of a function. Then by finding the values we will plot a graph.
Complete step by step solution:
We have been given an equation $y=\sqrt{x}+5$.
We have to plot a graph for the given equation.
We know that to plot a graph we have to find the domain and range of the given equation. As we know that domain is the input or x values of a function and range is the output or y values of a function.
For domain the number inside the square cannot be zero. i.e. $\sqrt{x}\ne 0$ and the values inside the square root will always be positive.
Now, we know that range is the output value which includes all positive real numbers excluding zero.
Now, plotting a graph of the given equation we will get
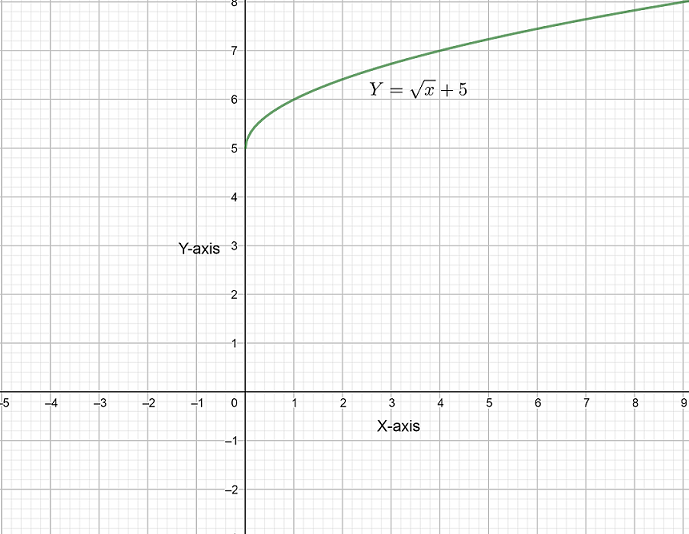
Hence above is the required graph of the given equation.
Note: The point to be noted is that every function has a parent function, so students may try to draw a parent graph first and then draw a function graph accordingly. The parent graph is the graph or parent function which is the root function.
Complete step by step solution:
We have been given an equation $y=\sqrt{x}+5$.
We have to plot a graph for the given equation.
We know that to plot a graph we have to find the domain and range of the given equation. As we know that domain is the input or x values of a function and range is the output or y values of a function.
For domain the number inside the square cannot be zero. i.e. $\sqrt{x}\ne 0$ and the values inside the square root will always be positive.
Now, we know that range is the output value which includes all positive real numbers excluding zero.
Now, plotting a graph of the given equation we will get
Hence above is the required graph of the given equation.
Note: The point to be noted is that every function has a parent function, so students may try to draw a parent graph first and then draw a function graph accordingly. The parent graph is the graph or parent function which is the root function.
Recently Updated Pages
Master Class 11 Computer Science: Engaging Questions & Answers for Success
Master Class 11 Business Studies: Engaging Questions & Answers for Success
Master Class 11 Economics: Engaging Questions & Answers for Success
Master Class 11 English: Engaging Questions & Answers for Success
Master Class 11 Maths: Engaging Questions & Answers for Success
Master Class 11 Biology: Engaging Questions & Answers for Success
Trending doubts
One Metric ton is equal to kg A 10000 B 1000 C 100 class 11 physics CBSE
There are 720 permutations of the digits 1 2 3 4 5 class 11 maths CBSE
Discuss the various forms of bacteria class 11 biology CBSE
Draw a diagram of a plant cell and label at least eight class 11 biology CBSE
State the laws of reflection of light
Explain zero factorial class 11 maths CBSE