


How do you graph \[y={{\log }_{2}}\left( x-2 \right)\]?
Answer
573.9k+ views
Hint: We know that for a logarithmic function \[{{\log }_{b}}a\] , the value of a is greater than zero and the value of b is greater than zero. For plotting the graph we will substitute some $x$ and find the corresponding value of the function and mark them and join them to get the curve.
Complete step by step answer:
Now from the given question, we were given to draw the graph of \[y={{\log }_{2}}\left( x-2 \right)\].
So, let us compare \[{{\log }_{2}}\left( x-2 \right)\] with \[{{\log }_{b}}a\].
Then it is clear that
\[\begin{align}
& x-2=a...(1) \\
& 2=b....(2) \\
\end{align}\]
We know that the value of b should be greater than zero. From equation (2), it is clear that the value of b is equal to 2. We know that 2 is greater than zero.
We know that the value of a should be greater than zero. From equation (1), it is clear that the value of a is equal to \[x-2\]. So, it is clear that
\[\begin{align}
& \Rightarrow x-2>0 \\
& \Rightarrow x>2 \\
\end{align}\]
So, it is clear that if the value of x is equal to 2, then the value of y is equal to infinite. We know that if the value of a is equal to 1 in \[{{\log }_{b}}a\], then the value of \[{{\log }_{b}}a\] is equal to 0.
So, if
\[\begin{align}
& \Rightarrow x-2=1 \\
& \Rightarrow x=3 \\
\end{align}\]
So, it is clear that if the value of x is equal to 3, then the value of y is equal to 0.
Now let us substiute the value of x is equal to 4.
\[\Rightarrow y={{\log }_{2}}\left( 4-2 \right)={{\log }_{2}}2=1\].
So, it is clear that if the value of x is equal to 4, then the value of y is equal to 1.
So, the points \[\left( 2,\infty \right),\left( 3,0 \right),\left( 4,1 \right)\] lie on the curve \[y={{\log }_{2}}\left( x-2 \right)\]. Now let us join these three points to have the graph of the equationn \[y={{\log }_{2}}\left( x-2 \right)\].
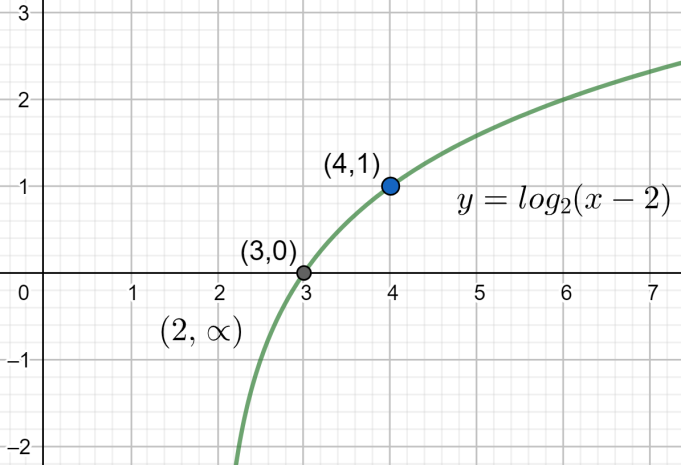
The above graph shows us the graph of \[y={{\log }_{2}}\left( x-2 \right)\].
Note: We should be very careful while plotting the points in the graph. Also, we should be very careful while finding the points to be plotted in the graph. We should be very careful while drawing the graph. Also, we should be very well known about drawing the graphs of logarithms. Similarly we can plot the graph of any logarithmic functions.
Complete step by step answer:
Now from the given question, we were given to draw the graph of \[y={{\log }_{2}}\left( x-2 \right)\].
So, let us compare \[{{\log }_{2}}\left( x-2 \right)\] with \[{{\log }_{b}}a\].
Then it is clear that
\[\begin{align}
& x-2=a...(1) \\
& 2=b....(2) \\
\end{align}\]
We know that the value of b should be greater than zero. From equation (2), it is clear that the value of b is equal to 2. We know that 2 is greater than zero.
We know that the value of a should be greater than zero. From equation (1), it is clear that the value of a is equal to \[x-2\]. So, it is clear that
\[\begin{align}
& \Rightarrow x-2>0 \\
& \Rightarrow x>2 \\
\end{align}\]
So, it is clear that if the value of x is equal to 2, then the value of y is equal to infinite. We know that if the value of a is equal to 1 in \[{{\log }_{b}}a\], then the value of \[{{\log }_{b}}a\] is equal to 0.
So, if
\[\begin{align}
& \Rightarrow x-2=1 \\
& \Rightarrow x=3 \\
\end{align}\]
So, it is clear that if the value of x is equal to 3, then the value of y is equal to 0.
Now let us substiute the value of x is equal to 4.
\[\Rightarrow y={{\log }_{2}}\left( 4-2 \right)={{\log }_{2}}2=1\].
So, it is clear that if the value of x is equal to 4, then the value of y is equal to 1.
So, the points \[\left( 2,\infty \right),\left( 3,0 \right),\left( 4,1 \right)\] lie on the curve \[y={{\log }_{2}}\left( x-2 \right)\]. Now let us join these three points to have the graph of the equationn \[y={{\log }_{2}}\left( x-2 \right)\].
The above graph shows us the graph of \[y={{\log }_{2}}\left( x-2 \right)\].
Note: We should be very careful while plotting the points in the graph. Also, we should be very careful while finding the points to be plotted in the graph. We should be very careful while drawing the graph. Also, we should be very well known about drawing the graphs of logarithms. Similarly we can plot the graph of any logarithmic functions.
Recently Updated Pages
Master Class 12 Social Science: Engaging Questions & Answers for Success
Master Class 12 Physics: Engaging Questions & Answers for Success
Master Class 12 Maths: Engaging Questions & Answers for Success
Master Class 12 Economics: Engaging Questions & Answers for Success
Master Class 12 Chemistry: Engaging Questions & Answers for Success
Master Class 12 Business Studies: Engaging Questions & Answers for Success
Trending doubts
Which are the Top 10 Largest Countries of the World?
Draw a labelled sketch of the human eye class 12 physics CBSE
Explain the structure of megasporangium class 12 biology CBSE
What are the major means of transport Explain each class 12 social science CBSE
How many chromosomes are found in human ovum a 46 b class 12 biology CBSE
The diagram of the section of a maize grain is given class 12 biology CBSE