


How do you graph $y=\ln x-1$?
Answer
597.3k+ views
Hint: We first try to plot the graph for $y=\ln x$. Then we find the graph for $y=\ln x-1$ by lowering the graph line of $y=\ln x$ by 1 unit. The lowering or ascending of the graph is totally dependent on the use of the constant 1 in the equation of $y=\ln x-1$.
Complete step-by-step solution:
We need to plot the graph of $y=\ln x-1$.
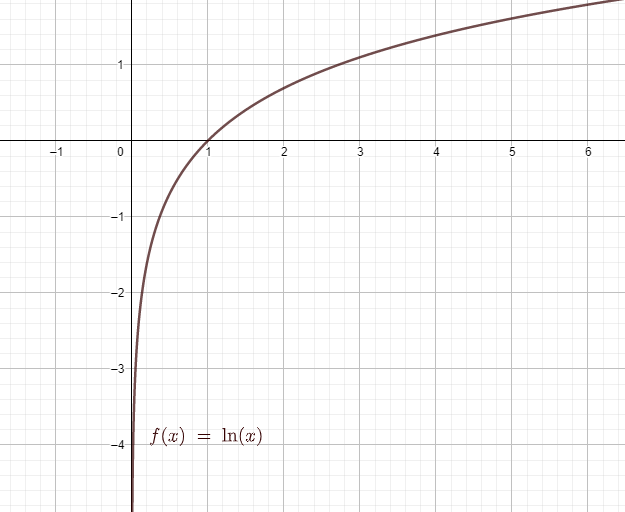
The usual common graph which is easier to plot on the graph is $y=\ln x$.
The graph is an increasing graph with range being $\left( -\infty ,\infty \right)$.
The domain for the graph $y=\ln x$ is $\left( 0,\infty \right)$.
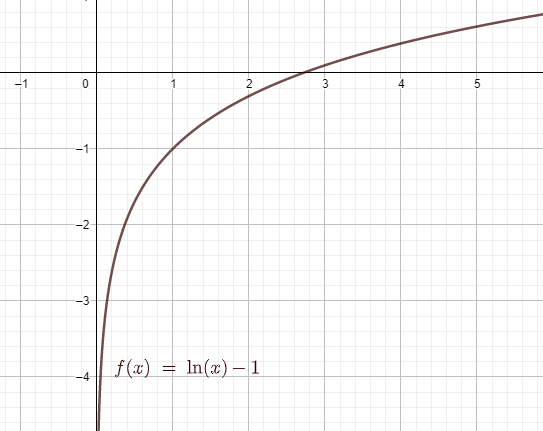
Now depending on the above-mentioned graph, we are going to find the graph of $y=\ln x-1$
The change between $y=\ln x$ and $y=\ln x-1$ is that for a particular value of $x$, we are going to find the value of $y$ being 1 less than the previous value for $y=\ln x$.
This means that we are going to lower the graph with respect to the previous graph line which is for $y=\ln x$ at the time of changing the graph from $y=\ln x$ to $y=\ln x-1$.
The domain for the graph $y=\ln x-1$ is $\left( 0,\infty \right)$.
The range for the graph $y=\ln x-1$ is $\left( -\infty ,\infty \right)$.
Note: We need to be careful about the change from $y=\ln x$ to $y=\ln x-1$. The lowering or ascending of the graph is dependent on the constant value that is being added. If the value is positive then graph ascends and if the value is negative then it descends.
Complete step-by-step solution:
We need to plot the graph of $y=\ln x-1$.
The usual common graph which is easier to plot on the graph is $y=\ln x$.
The graph is an increasing graph with range being $\left( -\infty ,\infty \right)$.
The domain for the graph $y=\ln x$ is $\left( 0,\infty \right)$.
Now depending on the above-mentioned graph, we are going to find the graph of $y=\ln x-1$
The change between $y=\ln x$ and $y=\ln x-1$ is that for a particular value of $x$, we are going to find the value of $y$ being 1 less than the previous value for $y=\ln x$.
This means that we are going to lower the graph with respect to the previous graph line which is for $y=\ln x$ at the time of changing the graph from $y=\ln x$ to $y=\ln x-1$.
The domain for the graph $y=\ln x-1$ is $\left( 0,\infty \right)$.
The range for the graph $y=\ln x-1$ is $\left( -\infty ,\infty \right)$.
Note: We need to be careful about the change from $y=\ln x$ to $y=\ln x-1$. The lowering or ascending of the graph is dependent on the constant value that is being added. If the value is positive then graph ascends and if the value is negative then it descends.
Recently Updated Pages
The given figure shows two endocrine glands marked class 11 biology NEET_UG
Match columnI with columnII and select the correct class 11 biology NEET
Match column I with column II and select the correct class 11 biology NEET_UG
Which floral family has left 9 right + 1 arrangement class 11 biology NEET_UG
Which is not a variety of sheep A Lohi B Beetal C Nellore class 11 biology NEET_UG
Match column I with column II and select the correct class 11 biology NEET_UG
Trending doubts
One Metric ton is equal to kg A 10000 B 1000 C 100 class 11 physics CBSE
Draw a diagram of a plant cell and label at least eight class 11 biology CBSE
Difference Between Prokaryotic Cells and Eukaryotic Cells
Draw a well labelled diagram of reflex arc and explain class 11 biology CBSE
Two of the body parts which do not appear in MRI are class 11 biology CBSE
1 ton equals to A 100 kg B 1000 kg C 10 kg D 10000 class 11 physics CBSE