


How do you graph $y=-\dfrac{2}{3}x+1$ ?
Answer
556.5k+ views
Hint: Here we need to find the graph for the given equation and we know that this is an equation of a straight line and the given equation is written in the slope-intercept form. So from there, we will get the value of the slope of the line and then the $y$ intercept. Then we will find the value of the $x$ intercepts by putting the value of $y$ as zero. Then using the slope and the intercepts, we will draw the graph accordingly.
Complete step by step solution:
Here we need to find the graph for the given equation and the given equation is $y=-\dfrac{2}{3}x+1$.
We know that this is an equation of a straight line and the given equation is written in the slope-intercept form.
We know that the slope-intercept form of an equation is given by $ y=mx+b$
Here, $m$ is the slope of the line and $b$ is the $y$ intercept.
Now, we will compare this equation with the given equation.
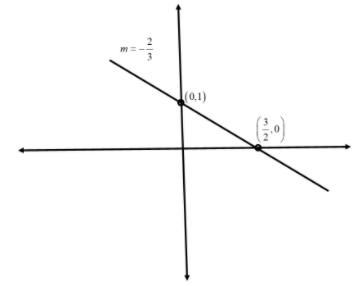
Slope in this case is $\dfrac{{ - 2}}{3}$ and $y$ intercept is equal to 1.
Now, we will find the $x$ intercepts by putting the value of $y$ as zero.
$ 0=-\dfrac{2}{3}x+1$
Now, we will subtract 1 from both sides.
$\Rightarrow 0-1=-\dfrac{2}{3}x+1-1$
On further simplification, we get
$ \Rightarrow - 1 = - \dfrac{2}{3}x$
Now, we will divide both sides by $\dfrac{{ - 2}}{3}$
$ \Rightarrow \dfrac{{ - 1}}{{ - \dfrac{2}{3}}} = \dfrac{{ - \dfrac{2}{3}x}}{{ - \dfrac{2}{3}}}$
On further simplification, we get
$\Rightarrow \dfrac{3}{2} = x \\
\Rightarrow x = \dfrac{3}{2} \\ $
Therefore, the $x$ intercept is equal to $\dfrac{3}{2}$.
Now, we will draw the graph using the slope and the intercepts.
Note:
Here we have obtained the value of the slope of the line using the slope-intercept form of the equation. The slope of a line is defined as the value which measures the steepness of the line or the inclination of the line with the $x$ axis. We know that the graph of a linear equation is always a straight line whereas the graph of a quadratic equation is always a curve. We can draw the graph of an equation by using the different points which are obtained by substituting different values of \[x\] and \[y\] in the equation.
Complete step by step solution:
Here we need to find the graph for the given equation and the given equation is $y=-\dfrac{2}{3}x+1$.
We know that this is an equation of a straight line and the given equation is written in the slope-intercept form.
We know that the slope-intercept form of an equation is given by $ y=mx+b$
Here, $m$ is the slope of the line and $b$ is the $y$ intercept.
Now, we will compare this equation with the given equation.
Slope in this case is $\dfrac{{ - 2}}{3}$ and $y$ intercept is equal to 1.
Now, we will find the $x$ intercepts by putting the value of $y$ as zero.
$ 0=-\dfrac{2}{3}x+1$
Now, we will subtract 1 from both sides.
$\Rightarrow 0-1=-\dfrac{2}{3}x+1-1$
On further simplification, we get
$ \Rightarrow - 1 = - \dfrac{2}{3}x$
Now, we will divide both sides by $\dfrac{{ - 2}}{3}$
$ \Rightarrow \dfrac{{ - 1}}{{ - \dfrac{2}{3}}} = \dfrac{{ - \dfrac{2}{3}x}}{{ - \dfrac{2}{3}}}$
On further simplification, we get
$\Rightarrow \dfrac{3}{2} = x \\
\Rightarrow x = \dfrac{3}{2} \\ $
Therefore, the $x$ intercept is equal to $\dfrac{3}{2}$.
Now, we will draw the graph using the slope and the intercepts.
Note:
Here we have obtained the value of the slope of the line using the slope-intercept form of the equation. The slope of a line is defined as the value which measures the steepness of the line or the inclination of the line with the $x$ axis. We know that the graph of a linear equation is always a straight line whereas the graph of a quadratic equation is always a curve. We can draw the graph of an equation by using the different points which are obtained by substituting different values of \[x\] and \[y\] in the equation.
Recently Updated Pages
Master Class 11 Computer Science: Engaging Questions & Answers for Success
Master Class 11 Business Studies: Engaging Questions & Answers for Success
Master Class 11 Economics: Engaging Questions & Answers for Success
Master Class 11 English: Engaging Questions & Answers for Success
Master Class 11 Maths: Engaging Questions & Answers for Success
Master Class 11 Biology: Engaging Questions & Answers for Success
Trending doubts
One Metric ton is equal to kg A 10000 B 1000 C 100 class 11 physics CBSE
There are 720 permutations of the digits 1 2 3 4 5 class 11 maths CBSE
Discuss the various forms of bacteria class 11 biology CBSE
Draw a diagram of a plant cell and label at least eight class 11 biology CBSE
State the laws of reflection of light
Explain zero factorial class 11 maths CBSE