


How do you graph \[y=\dfrac{1}{4}x-5\]?
Answer
573.6k+ views
Hint: In this problem, we have to graph the given equation. To graph the equation, we have to find the x-intercept and the y-intercept. We know that at the x-intercept, the value of y is 0 and at y-intercept, the value of x is 0. By substituting x equal to 0, we can get the y-intercept and y equal to 0, we can get x-intercept and we can plot the points in the graph.
Complete step-by-step solution:
We know that the given equation is,
\[y=\dfrac{1}{4}x-5\]……. (1)
Now we can find the x-intercept.
We know that at x-intercept, the value of y is 0.
We can substitute for y = 0, in equation (1), we get
\[\begin{align}
& \Rightarrow 0=\dfrac{1}{4}x-5 \\
& \Rightarrow \dfrac{1}{4}x=5 \\
\end{align}\]
Now we can multiply by 4 on both sides and cancel similar terms, we get
\[\begin{align}
& \Rightarrow \dfrac{4x}{4}=5\times 4 \\
& \Rightarrow x=20 \\
\end{align}\]
The x-intercept is \[\left( 20,0 \right)\]
Now we can find y-intercept.
We know that at y-intercept, the value of x is 0.
We can substitute for x = 0, in equation (1), we get
\[\begin{align}
& \Rightarrow y=\dfrac{1}{4}\left( 0 \right)-5 \\
& \Rightarrow y=-5 \\
\end{align}\]
The y-intercept is \[\left( 0,-5 \right)\] .
We can also find other points, through which the line passes.
For y = -2, the value of x is
\[\begin{align}
& \Rightarrow -2=\dfrac{x}{4}-5 \\
& \Rightarrow \dfrac{x}{4}=3 \\
& \Rightarrow x=12 \\
\end{align}\]
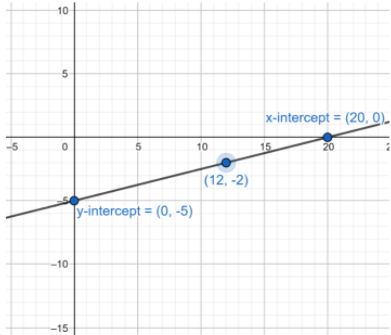
Therefore, the x-intercept is \[\left( 20,0 \right)\], the y-intercept is \[\left( 0,-5 \right)\] and the other point is \[\left( 12,-2 \right)\]
Now, we can plot the graph using the x-intercept \[\left( 20,0 \right)\], the y-intercept \[\left( 0,-5 \right)\]and the other point \[\left( 12,-2 \right)\].
Note: Students make mistakes while finding the value for x-intercept and the y-intercept, we should know that at the x-intercept, the value of y is 0 and at y-intercept, the value of x is 0. By substituting x equal to 0, we can get the y-intercept and y equal to 0, we can get x-intercept and we can plot the points in the graph.
Complete step-by-step solution:
We know that the given equation is,
\[y=\dfrac{1}{4}x-5\]……. (1)
Now we can find the x-intercept.
We know that at x-intercept, the value of y is 0.
We can substitute for y = 0, in equation (1), we get
\[\begin{align}
& \Rightarrow 0=\dfrac{1}{4}x-5 \\
& \Rightarrow \dfrac{1}{4}x=5 \\
\end{align}\]
Now we can multiply by 4 on both sides and cancel similar terms, we get
\[\begin{align}
& \Rightarrow \dfrac{4x}{4}=5\times 4 \\
& \Rightarrow x=20 \\
\end{align}\]
The x-intercept is \[\left( 20,0 \right)\]
Now we can find y-intercept.
We know that at y-intercept, the value of x is 0.
We can substitute for x = 0, in equation (1), we get
\[\begin{align}
& \Rightarrow y=\dfrac{1}{4}\left( 0 \right)-5 \\
& \Rightarrow y=-5 \\
\end{align}\]
The y-intercept is \[\left( 0,-5 \right)\] .
We can also find other points, through which the line passes.
For y = -2, the value of x is
\[\begin{align}
& \Rightarrow -2=\dfrac{x}{4}-5 \\
& \Rightarrow \dfrac{x}{4}=3 \\
& \Rightarrow x=12 \\
\end{align}\]
Therefore, the x-intercept is \[\left( 20,0 \right)\], the y-intercept is \[\left( 0,-5 \right)\] and the other point is \[\left( 12,-2 \right)\]
Now, we can plot the graph using the x-intercept \[\left( 20,0 \right)\], the y-intercept \[\left( 0,-5 \right)\]and the other point \[\left( 12,-2 \right)\].
Note: Students make mistakes while finding the value for x-intercept and the y-intercept, we should know that at the x-intercept, the value of y is 0 and at y-intercept, the value of x is 0. By substituting x equal to 0, we can get the y-intercept and y equal to 0, we can get x-intercept and we can plot the points in the graph.
Recently Updated Pages
Master Class 11 Social Science: Engaging Questions & Answers for Success
Master Class 11 Physics: Engaging Questions & Answers for Success
Master Class 11 Maths: Engaging Questions & Answers for Success
Master Class 11 Economics: Engaging Questions & Answers for Success
Master Class 11 Computer Science: Engaging Questions & Answers for Success
Master Class 11 Chemistry: Engaging Questions & Answers for Success
Trending doubts
One Metric ton is equal to kg A 10000 B 1000 C 100 class 11 physics CBSE
There are 720 permutations of the digits 1 2 3 4 5 class 11 maths CBSE
1 Quintal is equal to a 110 kg b 10 kg c 100kg d 1000 class 11 physics CBSE
State and prove Bernoullis theorem class 11 physics CBSE
Difference Between Prokaryotic Cells and Eukaryotic Cells
Which among the following are examples of coming together class 11 social science CBSE