


How do you graph $y=\dfrac{1}{4}x$?
Answer
533.4k+ views
Hint: We have given the equation in two variables and we have to plot a graph by using the given equation. We will substitute the different values of x in the given equation and find the value of y. Then we plot points on the graph and join them to form a line.
Complete step by step solution:
We have been given an equation $y=\dfrac{1}{4}x$.
We have to plot a graph for the given equation.
Now, we know that the given equation is an equation in two variables. First let us substitute different values of x in the given equation and obtain different values of y.
Now, let us substitute $x=0$ in the given equation then we will get
$\begin{align}
& \Rightarrow y=\dfrac{1}{4}\times 0 \\
& \Rightarrow y=0 \\
\end{align}$
Therefore we get the point $\left( 0,0 \right)$.
Now, let us substitute $x=4$ in the given equation then we will get
$\begin{align}
& \Rightarrow y=\dfrac{1}{4}\times 4 \\
& \Rightarrow y=1 \\
\end{align}$
Therefore we get the point $\left( 4,1 \right)$.
Now, let us plot the points $\left( 0,0 \right)$ and $\left( 4,1 \right)$ on the graph and join them, then we will get
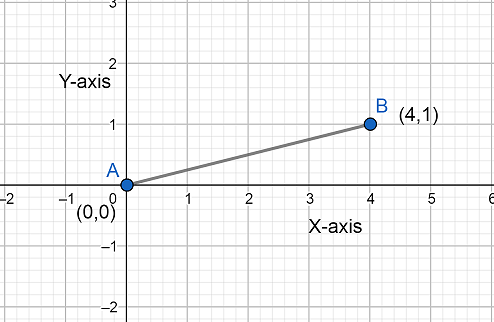
Hence we get a straight line by plotting a graph for the given equation.
Note: We can also use the slope-intercept form of a line to find the points and then plot a graph. The line-intercept form of a line is given by the equation $y=mx+c$, where m is the slope of the line and c is the y-intercept of the line.
Complete step by step solution:
We have been given an equation $y=\dfrac{1}{4}x$.
We have to plot a graph for the given equation.
Now, we know that the given equation is an equation in two variables. First let us substitute different values of x in the given equation and obtain different values of y.
Now, let us substitute $x=0$ in the given equation then we will get
$\begin{align}
& \Rightarrow y=\dfrac{1}{4}\times 0 \\
& \Rightarrow y=0 \\
\end{align}$
Therefore we get the point $\left( 0,0 \right)$.
Now, let us substitute $x=4$ in the given equation then we will get
$\begin{align}
& \Rightarrow y=\dfrac{1}{4}\times 4 \\
& \Rightarrow y=1 \\
\end{align}$
Therefore we get the point $\left( 4,1 \right)$.
Now, let us plot the points $\left( 0,0 \right)$ and $\left( 4,1 \right)$ on the graph and join them, then we will get
Hence we get a straight line by plotting a graph for the given equation.
Note: We can also use the slope-intercept form of a line to find the points and then plot a graph. The line-intercept form of a line is given by the equation $y=mx+c$, where m is the slope of the line and c is the y-intercept of the line.
Recently Updated Pages
Master Class 11 Computer Science: Engaging Questions & Answers for Success
Master Class 11 Business Studies: Engaging Questions & Answers for Success
Master Class 11 Economics: Engaging Questions & Answers for Success
Master Class 11 English: Engaging Questions & Answers for Success
Master Class 11 Maths: Engaging Questions & Answers for Success
Master Class 11 Biology: Engaging Questions & Answers for Success
Trending doubts
One Metric ton is equal to kg A 10000 B 1000 C 100 class 11 physics CBSE
There are 720 permutations of the digits 1 2 3 4 5 class 11 maths CBSE
Discuss the various forms of bacteria class 11 biology CBSE
Draw a diagram of a plant cell and label at least eight class 11 biology CBSE
State the laws of reflection of light
Explain zero factorial class 11 maths CBSE