


How do you graph $y=\dfrac{1}{4}x+5$?
Answer
580.2k+ views
Hint: Now to graph the given equation we will first find some solutions to the equation. We can substitute the values of x and find corresponding values of y obtained. Hence plot the points $\left( x,y \right)$ on a graph and draw a line passing through all the points. Hence we get the graph of the solution.
Complete step-by-step answer:
Now we are given the equation $y=\dfrac{1}{4}x+5$ to graph the equation. We will first find some of the solutions of the equation.
To find the solution of the equation we will substitute different values of x and then find the3 corresponding values of y.
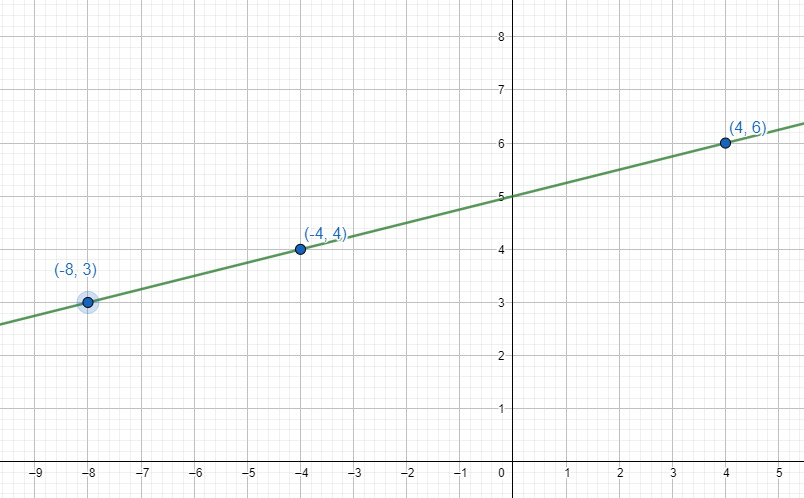
Now first let us substitute x = 4 in the equation then we get the corresponding value of y as $y=\dfrac{1}{4}\times 4+5=6$
Similarly now let us substitute x = - 4 then we get the value of y as $y=\dfrac{1}{4}\times \left( -4 \right)+5=4$
Again let us substitute x = - 8 in the equation hence we get the value of y as $y=\dfrac{1}{4}\times \left( 8 \right)+5=7$
Hence we get the solution of the equation (4, 6), (-4, 4) and (-8, 7)
Now we will plot these points on a graph and draw a line passing through all the points.
Hence we get,
Note: Note that we can select any value of x and plot the points but choose the value wisely such that we get y as an integer so that it will be easy to plot the point (x, y) on the graph. Also plot always positive as well as negative points so we get precise lines.
Complete step-by-step answer:
Now we are given the equation $y=\dfrac{1}{4}x+5$ to graph the equation. We will first find some of the solutions of the equation.
To find the solution of the equation we will substitute different values of x and then find the3 corresponding values of y.
Now first let us substitute x = 4 in the equation then we get the corresponding value of y as $y=\dfrac{1}{4}\times 4+5=6$
Similarly now let us substitute x = - 4 then we get the value of y as $y=\dfrac{1}{4}\times \left( -4 \right)+5=4$
Again let us substitute x = - 8 in the equation hence we get the value of y as $y=\dfrac{1}{4}\times \left( 8 \right)+5=7$
Hence we get the solution of the equation (4, 6), (-4, 4) and (-8, 7)
Now we will plot these points on a graph and draw a line passing through all the points.
Hence we get,
Note: Note that we can select any value of x and plot the points but choose the value wisely such that we get y as an integer so that it will be easy to plot the point (x, y) on the graph. Also plot always positive as well as negative points so we get precise lines.
Recently Updated Pages
Master Class 12 Business Studies: Engaging Questions & Answers for Success
Master Class 12 Biology: Engaging Questions & Answers for Success
Master Class 12 Chemistry: Engaging Questions & Answers for Success
Class 12 Question and Answer - Your Ultimate Solutions Guide
Master Class 11 Social Science: Engaging Questions & Answers for Success
Master Class 11 English: Engaging Questions & Answers for Success
Trending doubts
Find the sum of series 1 + 2 + 3 + 4 + 5 + + 100 class 9 maths CBSE
Fill the blanks with the suitable prepositions 1 The class 9 english CBSE
Difference Between Plant Cell and Animal Cell
How many hours before the closure of election must class 9 social science CBSE
What is pollution? How many types of pollution? Define it
Name 10 Living and Non living things class 9 biology CBSE