


How do you graph \[y=\dfrac{1}{2}\cos 2x\]?
Answer
541.2k+ views
Hint: To draw the graph of \[y=\dfrac{1}{2}\cos 2x\], we have to know some standard values of \[\cos ine\] function. We will use the form \[a\cos \left( bx-c \right)+d\] to find out the amplitude, period, phase shift and vertical shift.
Complete step-by-step solution:
From the question it is clear that we have to find the graph \[y=\dfrac{1}{2}\cos 2x\].
Before drawing the graph, first we have to know the amplitude, period, phase shift and vertical shift.
Now we will use a simple form \[a\cos \left( bx-c \right)+d\] to find out the amplitude, period, phase shift and vertical shift.
Now compare \[y=\dfrac{1}{2}\cos 2x\] with \[a\cos \left( bx-c \right)+d\], we get \[a=\dfrac{1}{2}\], \[b=2\], \[c=0\] \[d=0\]
Amplitude of given function is \[\left| a \right|\]. here \[a=\dfrac{1}{2}\]
\[\begin{align}
& \Rightarrow \left| a \right|=\left| \dfrac{1}{2} \right| \\
& \Rightarrow \left| a \right|=\dfrac{1}{2} \\
\end{align}\]
\[\dfrac{1}{2}\]is the amplitude of \[y=\dfrac{1}{2}\cos 2x\].
The period of function can be calculated by \[\dfrac{2\pi }{\left| b \right|}\].
We know that \[b=2\]. so \[b=2\]put in \[\dfrac{2\pi }{\left| b \right|}\]we get
\[\begin{align}
& \Rightarrow \dfrac{2\pi }{\left| b \right|}=\dfrac{2\pi }{\left| 2 \right|} \\
& \Rightarrow \dfrac{2\pi }{\left| b \right|}=\pi \\
\end{align}\]
\[\pi \] is the period of the function.
The phase shift of the function can be calculated by \[\dfrac{c}{b}\]
We know that \[c=0\] and \[b=2\].
Since \[c=0\], we get \[\dfrac{c}{b}=0\]
\[0\] is the phase shift of \[y=\dfrac{1}{2}\cos 2x\].
\[d\] is the vertical shift of the function.
Here \[d=0\] , so there is no vertical shift in \[y=\dfrac{1}{2}\cos 2x\].
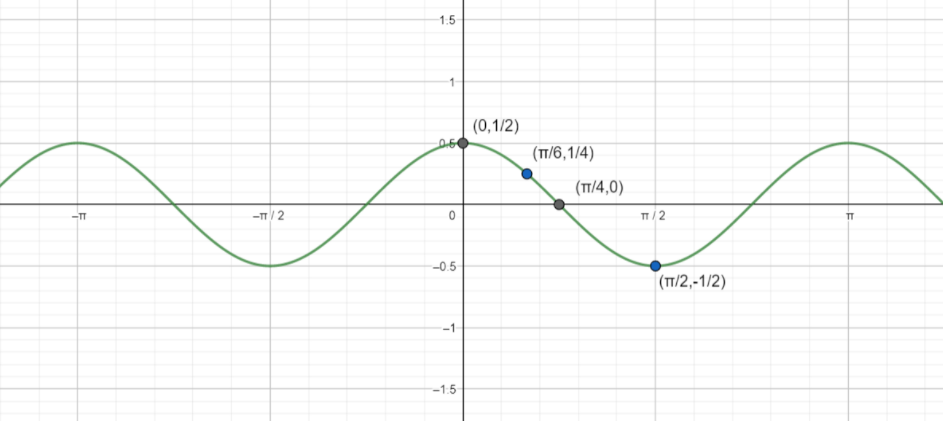
Now let us try to get some values\[y\] by keeping different \[x\] values.
Now replace \[x=0\] in \[y=\dfrac{1}{2}\cos 2x\].now we will get
\[\Rightarrow y=\dfrac{1}{2}\cos 2\left( 0 \right)\]
\[\Rightarrow y=\dfrac{1}{2}\cos 0\]
We know from the standard cosine values that \[\cos 0=1\]
\[\Rightarrow y=\dfrac{1}{2}\]
At \[x=0\] , \[y=\dfrac{1}{2}\]
Now put \[x=\dfrac{\pi }{6}\] in \[y=\dfrac{1}{2}\cos 2x\] we get,
\[\begin{align}
& \Rightarrow y=\dfrac{1}{2}\cos 2\left( \dfrac{\pi }{6} \right) \\
& \Rightarrow y=\dfrac{1}{2}\cos \dfrac{\pi }{3} \\
\end{align}\]
We know \[\cos \dfrac{\pi }{3}=\dfrac{1}{2}\]
\[\begin{align}
& \Rightarrow y=\dfrac{1}{2}\times \dfrac{1}{2} \\
& \Rightarrow y=\dfrac{1}{4} \\
\end{align}\]
At \[x=\dfrac{\pi }{6}\],\[y=\dfrac{1}{4}\].
Now put \[x=\dfrac{\pi }{4}\] in \[y=\dfrac{1}{2}\cos 2x\]. We get
\[\begin{align}
& \Rightarrow y=\dfrac{1}{2}\cos 2\left( \dfrac{\pi }{4} \right) \\
& \Rightarrow y=\dfrac{1}{2}\cos \left( \dfrac{\pi }{2} \right) \\
\end{align}\]
We know that \[\cos \left( \dfrac{\pi }{2} \right)=0\]
So,
\[\Rightarrow y=\dfrac{1}{2}\times 0\]
\[\Rightarrow y=0\]
At \[x=\dfrac{\pi }{4}\],\[y=0\]
Now put \[x=\dfrac{\pi }{2}\] in \[y=\dfrac{1}{2}\cos 2x\].
\[\begin{align}
& \Rightarrow y=\dfrac{1}{2}\cos 2\left( \dfrac{\pi }{2} \right) \\
& \Rightarrow y=\dfrac{1}{2}\cos \pi \\
\end{align}\]
We know that \[\cos \pi =-1\]
\[\begin{align}
& \Rightarrow y=\dfrac{1}{2}\left( -1 \right) \\
& \Rightarrow y=-\dfrac{1}{2} \\
\end{align}\]
At \[x=\dfrac{\pi }{2}\],\[y=-\dfrac{1}{2}\]
Now try to plot these points on the graph sheet.
Note: Students have to know the standard values of cosine function. Students have to be careful while choosing scale on axis and plotting the points on the graph sheet. Students have to do calculations correctly. Small calculation errors may lead to drawing the \[y=\dfrac{1}{2}\cos 2x\] graph wrong.
Complete step-by-step solution:
From the question it is clear that we have to find the graph \[y=\dfrac{1}{2}\cos 2x\].
Before drawing the graph, first we have to know the amplitude, period, phase shift and vertical shift.
Now we will use a simple form \[a\cos \left( bx-c \right)+d\] to find out the amplitude, period, phase shift and vertical shift.
Now compare \[y=\dfrac{1}{2}\cos 2x\] with \[a\cos \left( bx-c \right)+d\], we get \[a=\dfrac{1}{2}\], \[b=2\], \[c=0\] \[d=0\]
Amplitude of given function is \[\left| a \right|\]. here \[a=\dfrac{1}{2}\]
\[\begin{align}
& \Rightarrow \left| a \right|=\left| \dfrac{1}{2} \right| \\
& \Rightarrow \left| a \right|=\dfrac{1}{2} \\
\end{align}\]
\[\dfrac{1}{2}\]is the amplitude of \[y=\dfrac{1}{2}\cos 2x\].
The period of function can be calculated by \[\dfrac{2\pi }{\left| b \right|}\].
We know that \[b=2\]. so \[b=2\]put in \[\dfrac{2\pi }{\left| b \right|}\]we get
\[\begin{align}
& \Rightarrow \dfrac{2\pi }{\left| b \right|}=\dfrac{2\pi }{\left| 2 \right|} \\
& \Rightarrow \dfrac{2\pi }{\left| b \right|}=\pi \\
\end{align}\]
\[\pi \] is the period of the function.
The phase shift of the function can be calculated by \[\dfrac{c}{b}\]
We know that \[c=0\] and \[b=2\].
Since \[c=0\], we get \[\dfrac{c}{b}=0\]
\[0\] is the phase shift of \[y=\dfrac{1}{2}\cos 2x\].
\[d\] is the vertical shift of the function.
Here \[d=0\] , so there is no vertical shift in \[y=\dfrac{1}{2}\cos 2x\].
Now let us try to get some values\[y\] by keeping different \[x\] values.
Now replace \[x=0\] in \[y=\dfrac{1}{2}\cos 2x\].now we will get
\[\Rightarrow y=\dfrac{1}{2}\cos 2\left( 0 \right)\]
\[\Rightarrow y=\dfrac{1}{2}\cos 0\]
We know from the standard cosine values that \[\cos 0=1\]
\[\Rightarrow y=\dfrac{1}{2}\]
At \[x=0\] , \[y=\dfrac{1}{2}\]
Now put \[x=\dfrac{\pi }{6}\] in \[y=\dfrac{1}{2}\cos 2x\] we get,
\[\begin{align}
& \Rightarrow y=\dfrac{1}{2}\cos 2\left( \dfrac{\pi }{6} \right) \\
& \Rightarrow y=\dfrac{1}{2}\cos \dfrac{\pi }{3} \\
\end{align}\]
We know \[\cos \dfrac{\pi }{3}=\dfrac{1}{2}\]
\[\begin{align}
& \Rightarrow y=\dfrac{1}{2}\times \dfrac{1}{2} \\
& \Rightarrow y=\dfrac{1}{4} \\
\end{align}\]
At \[x=\dfrac{\pi }{6}\],\[y=\dfrac{1}{4}\].
Now put \[x=\dfrac{\pi }{4}\] in \[y=\dfrac{1}{2}\cos 2x\]. We get
\[\begin{align}
& \Rightarrow y=\dfrac{1}{2}\cos 2\left( \dfrac{\pi }{4} \right) \\
& \Rightarrow y=\dfrac{1}{2}\cos \left( \dfrac{\pi }{2} \right) \\
\end{align}\]
We know that \[\cos \left( \dfrac{\pi }{2} \right)=0\]
So,
\[\Rightarrow y=\dfrac{1}{2}\times 0\]
\[\Rightarrow y=0\]
At \[x=\dfrac{\pi }{4}\],\[y=0\]
Now put \[x=\dfrac{\pi }{2}\] in \[y=\dfrac{1}{2}\cos 2x\].
\[\begin{align}
& \Rightarrow y=\dfrac{1}{2}\cos 2\left( \dfrac{\pi }{2} \right) \\
& \Rightarrow y=\dfrac{1}{2}\cos \pi \\
\end{align}\]
We know that \[\cos \pi =-1\]
\[\begin{align}
& \Rightarrow y=\dfrac{1}{2}\left( -1 \right) \\
& \Rightarrow y=-\dfrac{1}{2} \\
\end{align}\]
At \[x=\dfrac{\pi }{2}\],\[y=-\dfrac{1}{2}\]
Now try to plot these points on the graph sheet.
Note: Students have to know the standard values of cosine function. Students have to be careful while choosing scale on axis and plotting the points on the graph sheet. Students have to do calculations correctly. Small calculation errors may lead to drawing the \[y=\dfrac{1}{2}\cos 2x\] graph wrong.
Recently Updated Pages
Master Class 11 Social Science: Engaging Questions & Answers for Success
Master Class 11 Physics: Engaging Questions & Answers for Success
Master Class 11 Maths: Engaging Questions & Answers for Success
Master Class 11 Economics: Engaging Questions & Answers for Success
Master Class 11 Computer Science: Engaging Questions & Answers for Success
Master Class 11 Chemistry: Engaging Questions & Answers for Success
Trending doubts
One Metric ton is equal to kg A 10000 B 1000 C 100 class 11 physics CBSE
There are 720 permutations of the digits 1 2 3 4 5 class 11 maths CBSE
1 Quintal is equal to a 110 kg b 10 kg c 100kg d 1000 class 11 physics CBSE
State and prove Bernoullis theorem class 11 physics CBSE
Difference Between Prokaryotic Cells and Eukaryotic Cells
Discuss the various forms of bacteria class 11 biology CBSE