


How do you graph $y=\dfrac{1}{2}$.
Answer
597k+ views
Hint: The above given question is a graph of linear equations in one variable. Since, we know that the slope intercept form of the line equation is given as y = mx + c, where m is the slope of the line and c is the y-intercept. In the given equation $y=\dfrac{1}{2}$, we have m = 0 and $c=\dfrac{1}{2}$ . So, the line $y=\dfrac{1}{2}$ will be parallel to x-axis as slope is equal to 0 and intersect y-axis at coordinate $\left( 0,\dfrac{1}{2} \right)$.
Complete step by step answer:
We know that the above question is of the graph of linear equations in one variable.
We also know that the slope-intercept form of the linear equation is given y = mx + c, where m is the slope of the line and c is the y-intercept.
Now, we will compare the equation $y=\dfrac{1}{2}$ with the general equation y = mx + c.
After comparing we will get: m = 0 and $c=\dfrac{1}{2}$.
So, the slope of the line $y=\dfrac{1}{2}$ is equal to 0, and the y-intercept is equal to $\dfrac{1}{2}$.
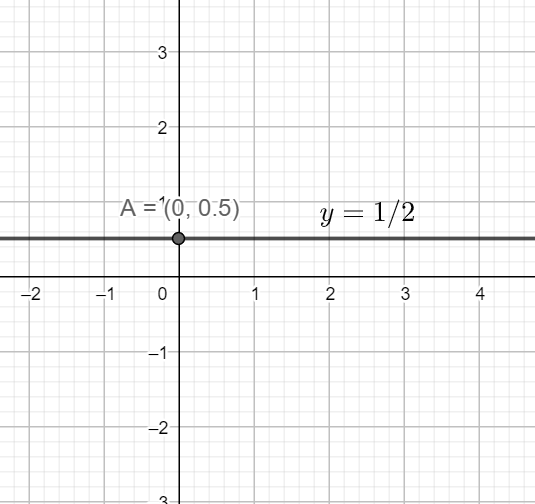
Since slope of the line is equal to 0, hence the line will be parallel to the x-axis and also y-intercept is equal to $\dfrac{1}{2}$. So, it will intersect the y-axis at the point $\left( 0,\dfrac{1}{2} \right)$.
So, the required graph of the line $y=\dfrac{1}{2}$ is:
This is our required solution.
Note:
Student are required to note that in $y=\dfrac{1}{2}$ , we have a coefficient of y is 1, so the coefficient of x is equal to the slope of the given line. Also, when we have the general equation of the line as ax + by + c = 0, we can plot them by just getting two or three coordinate or point lying on the line and then we will plot those point on the graph and after joining those point we will get the required line.
Complete step by step answer:
We know that the above question is of the graph of linear equations in one variable.
We also know that the slope-intercept form of the linear equation is given y = mx + c, where m is the slope of the line and c is the y-intercept.
Now, we will compare the equation $y=\dfrac{1}{2}$ with the general equation y = mx + c.
After comparing we will get: m = 0 and $c=\dfrac{1}{2}$.
So, the slope of the line $y=\dfrac{1}{2}$ is equal to 0, and the y-intercept is equal to $\dfrac{1}{2}$.
Since slope of the line is equal to 0, hence the line will be parallel to the x-axis and also y-intercept is equal to $\dfrac{1}{2}$. So, it will intersect the y-axis at the point $\left( 0,\dfrac{1}{2} \right)$.
So, the required graph of the line $y=\dfrac{1}{2}$ is:
This is our required solution.
Note:
Student are required to note that in $y=\dfrac{1}{2}$ , we have a coefficient of y is 1, so the coefficient of x is equal to the slope of the given line. Also, when we have the general equation of the line as ax + by + c = 0, we can plot them by just getting two or three coordinate or point lying on the line and then we will plot those point on the graph and after joining those point we will get the required line.
Recently Updated Pages
Master Class 12 Economics: Engaging Questions & Answers for Success
Master Class 12 English: Engaging Questions & Answers for Success
Master Class 12 Social Science: Engaging Questions & Answers for Success
Master Class 12 Maths: Engaging Questions & Answers for Success
Master Class 12 Physics: Engaging Questions & Answers for Success
Master Class 10 English: Engaging Questions & Answers for Success
Trending doubts
Explain the Treaty of Vienna of 1815 class 10 social science CBSE
Why is it 530 pm in india when it is 1200 afternoon class 10 social science CBSE
What is the full form of POSCO class 10 social science CBSE
Define Potential, Developed, Stock and Reserved resources
The speaker of the Lok Sabha is elected by the APresident class 10 social science CBSE
Complete the sentence with the most appropriate word class 10 english CBSE