


How do you graph $y=4x+3$ using a table?
Answer
586.5k+ views
Hint: To draw the graph of the above equation $y=4x+3$, we are going to plot the points which have x and y coordinates. Take the integral value of x from -2 to +2 and then substitute these points of x and see what coordinates of y, we are getting. Then plot these points on the graph paper.
Complete step by step answer:
The equation given above is a straight line equation and the equation is as follows:
$y=4x+3$
Now, we are going to take the integral values of x from -2 to +2 and then see what values of y we are getting.
Substituting x as -2 in the above equation we get,
$\begin{align}
& y=4\left( -2 \right)+3 \\
& \Rightarrow y=-8+3=-5 \\
\end{align}$
From the above, the first point we got as (-2, 5).
Substituting x as -1 in the above equation we get,
$\begin{align}
& y=4\left( -1 \right)+3 \\
& \Rightarrow y=-4+3=-1 \\
\end{align}$
From the above, second point we got as (-1, -1)
Substituting x as 0 in the above equation we get,
$\begin{align}
& y=4\left( 0 \right)+3 \\
& \Rightarrow y=0+3=3 \\
\end{align}$
From the above, third point we got as (0, 3).
Substituting x as 1 in the above equation we get,
$\begin{align}
& y=4\left( 1 \right)+3 \\
& \Rightarrow y=4+3=7 \\
\end{align}$
From the above, fourth point we got as (1, 7).
Substituting x as 2 in the above equation we get,
$\begin{align}
& y=4\left( 2 \right)+3 \\
& \Rightarrow y=8+3=11 \\
\end{align}$
From the above, fifth point we got as (2, 11).
From the above, we have tabulated the points that we solved above as follows:
Now, we are going to plot these points on the graph paper as follows:
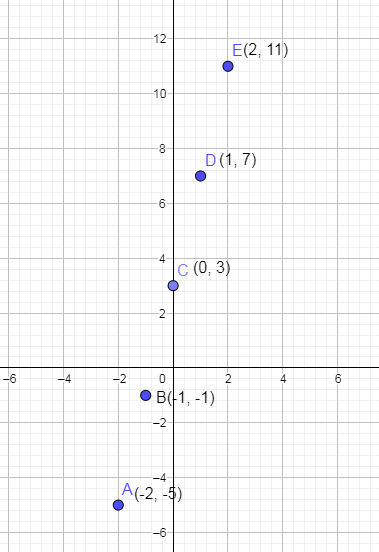
In the above, we have marked the points by A, B, C, D and E. Now, we will join these points to make a straight line.
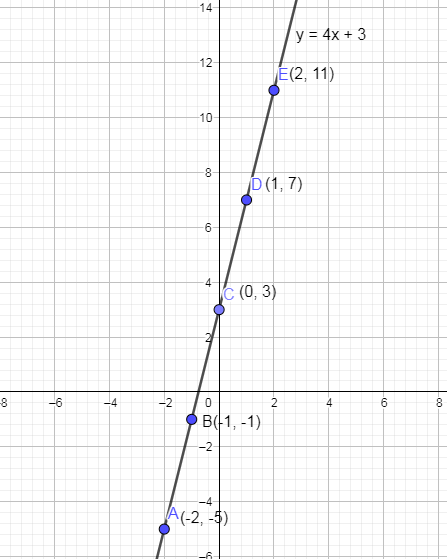
Hence, we have drawn the equation $y=4x+3$ on the graph paper.
Note:
You can check the equation of straight line that we drew is correct or not by marking the y coordinate as 6 and on the straight line then to find the x coordinate corresponding to 6 we are going to drop a perpendicular on the x axis from the point on the line and then see at what x values, y is 6.
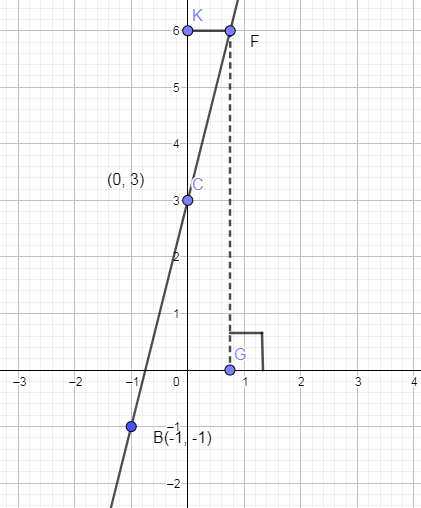
In the above graph, as you can see that point F is the point whose y coordinate is 6 which we have shown by point K and the x coordinate that you can see is the intersection of the perpendicular from point F on the x axis and the point is G and the x coordinate of G is $\dfrac{3}{4}$.
This x coordinate you can see by zooming into point G.

Now, substituting the value of y as 6 in the above equation and we get,
$\begin{align}
& 6=4x+3 \\
& \Rightarrow 6-3=4x \\
& \Rightarrow 3=4x \\
& \Rightarrow x=\dfrac{3}{4}=0.75 \\
\end{align}$
As you can see that we are getting the same value of x which we got from the graph.
Hence, this means that the graph which we drew above is correct.
Complete step by step answer:
The equation given above is a straight line equation and the equation is as follows:
$y=4x+3$
Now, we are going to take the integral values of x from -2 to +2 and then see what values of y we are getting.
Substituting x as -2 in the above equation we get,
$\begin{align}
& y=4\left( -2 \right)+3 \\
& \Rightarrow y=-8+3=-5 \\
\end{align}$
From the above, the first point we got as (-2, 5).
Substituting x as -1 in the above equation we get,
$\begin{align}
& y=4\left( -1 \right)+3 \\
& \Rightarrow y=-4+3=-1 \\
\end{align}$
From the above, second point we got as (-1, -1)
Substituting x as 0 in the above equation we get,
$\begin{align}
& y=4\left( 0 \right)+3 \\
& \Rightarrow y=0+3=3 \\
\end{align}$
From the above, third point we got as (0, 3).
Substituting x as 1 in the above equation we get,
$\begin{align}
& y=4\left( 1 \right)+3 \\
& \Rightarrow y=4+3=7 \\
\end{align}$
From the above, fourth point we got as (1, 7).
Substituting x as 2 in the above equation we get,
$\begin{align}
& y=4\left( 2 \right)+3 \\
& \Rightarrow y=8+3=11 \\
\end{align}$
From the above, fifth point we got as (2, 11).
From the above, we have tabulated the points that we solved above as follows:
| x | -2 | -1 | 0 | 1 | 2 |
| y | -5 | -1 | 3 | 7 | 11 |
Now, we are going to plot these points on the graph paper as follows:
In the above, we have marked the points by A, B, C, D and E. Now, we will join these points to make a straight line.
Hence, we have drawn the equation $y=4x+3$ on the graph paper.
Note:
You can check the equation of straight line that we drew is correct or not by marking the y coordinate as 6 and on the straight line then to find the x coordinate corresponding to 6 we are going to drop a perpendicular on the x axis from the point on the line and then see at what x values, y is 6.
In the above graph, as you can see that point F is the point whose y coordinate is 6 which we have shown by point K and the x coordinate that you can see is the intersection of the perpendicular from point F on the x axis and the point is G and the x coordinate of G is $\dfrac{3}{4}$.
This x coordinate you can see by zooming into point G.
Now, substituting the value of y as 6 in the above equation and we get,
$\begin{align}
& 6=4x+3 \\
& \Rightarrow 6-3=4x \\
& \Rightarrow 3=4x \\
& \Rightarrow x=\dfrac{3}{4}=0.75 \\
\end{align}$
As you can see that we are getting the same value of x which we got from the graph.
Hence, this means that the graph which we drew above is correct.
Recently Updated Pages
Master Class 12 Business Studies: Engaging Questions & Answers for Success
Master Class 12 Biology: Engaging Questions & Answers for Success
Master Class 12 Chemistry: Engaging Questions & Answers for Success
Class 12 Question and Answer - Your Ultimate Solutions Guide
Master Class 11 Social Science: Engaging Questions & Answers for Success
Master Class 11 English: Engaging Questions & Answers for Success
Trending doubts
Explain the Treaty of Vienna of 1815 class 10 social science CBSE
Which Indian city is known as the "City of Victory"?
Which instrument is used to measure the Blood Pressure?
Who Won 36 Oscar Awards? Record Holder Revealed
What is the median of the first 10 natural numbers class 10 maths CBSE
Why is it 530 pm in india when it is 1200 afternoon class 10 social science CBSE