


How do you graph $y=2x+3$?
Answer
579.3k+ views
Hint: We are given an equation $y=2x+3$, so we will learn about the type of equation and then depending on the type, we will learn what type of graph it should be. We will then find the point which would satisfy the given equation. To get the graph, we will plot those points on the graph and then join those points to get the required graph.
Complete step-by-step solution:
We have $y=2x+3$. We can see here that $x$ and $y$ are in linear scale since their power is $1$. Now we get that our function $y=2x+3$ is a linear function.
Linear function graph is a straight line. So, the graph of our equation $y=2x+3$ will also be a straight line. Now, to find the graph, we have to first find the point that satisfies this equation $y=2x+3$. To do so, we will consider the value of $x$ or $y$ by ourselves and then look for the corresponding value of $y$ or $x$.
Now as we have $y=2x+3$, we will take $x=1$.
We put $x=1$ in $y=2x+3$, so we get,
$\begin{align}
& y=2\times 1+3 \\
& \Rightarrow y=5 \\
\end{align}$
So for $x=1$, we have $y=5$
Similarly, we will find the other points also.
Let us consider $x=0$
So, putting $x=0$ in $y=2x+3$, we get,
$\begin{align}
& y=2\times 0+3 \\
& \Rightarrow y=3 \\
\end{align}$
So, for $x=0$, we have $y=3$
Now, let us consider another value too.
Let us consider $x=-1$
So, putting $x=-1$ in $y=2x+3$, we get,
$\begin{align}
& y=2\times \left( -1 \right)+3 \\
& \Rightarrow y=-2+3 \\
& \Rightarrow y=+1 \\
\end{align}$
So, for $x=-1$, we have $y=1$
Now we have got the points as,
Now, we will plot these points on the graph and join the points. The line thus obtained will be our graph of $y=2x+3$.
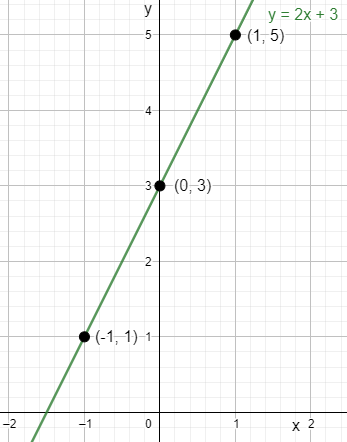
This is the graph of $y=2x+3$.
Note: Another way to graph this is to use the intercept. It means that to plot the graph, instead of finding the arbitrary points, we can just find the $x$ and $y$ intercept and plot the graph. To find the $x$ intercept, we put $y=0$ and solve for $x$ and to find the $y$ intercept, we put $x=0$ and solve for $y$.
Complete step-by-step solution:
We have $y=2x+3$. We can see here that $x$ and $y$ are in linear scale since their power is $1$. Now we get that our function $y=2x+3$ is a linear function.
Linear function graph is a straight line. So, the graph of our equation $y=2x+3$ will also be a straight line. Now, to find the graph, we have to first find the point that satisfies this equation $y=2x+3$. To do so, we will consider the value of $x$ or $y$ by ourselves and then look for the corresponding value of $y$ or $x$.
Now as we have $y=2x+3$, we will take $x=1$.
We put $x=1$ in $y=2x+3$, so we get,
$\begin{align}
& y=2\times 1+3 \\
& \Rightarrow y=5 \\
\end{align}$
So for $x=1$, we have $y=5$
Similarly, we will find the other points also.
Let us consider $x=0$
So, putting $x=0$ in $y=2x+3$, we get,
$\begin{align}
& y=2\times 0+3 \\
& \Rightarrow y=3 \\
\end{align}$
So, for $x=0$, we have $y=3$
Now, let us consider another value too.
Let us consider $x=-1$
So, putting $x=-1$ in $y=2x+3$, we get,
$\begin{align}
& y=2\times \left( -1 \right)+3 \\
& \Rightarrow y=-2+3 \\
& \Rightarrow y=+1 \\
\end{align}$
So, for $x=-1$, we have $y=1$
Now we have got the points as,
| $x$ | $-1$ | $0$ | $1$ |
| $y$ | $1$ | $3$ | $5$ |
Now, we will plot these points on the graph and join the points. The line thus obtained will be our graph of $y=2x+3$.
This is the graph of $y=2x+3$.
Note: Another way to graph this is to use the intercept. It means that to plot the graph, instead of finding the arbitrary points, we can just find the $x$ and $y$ intercept and plot the graph. To find the $x$ intercept, we put $y=0$ and solve for $x$ and to find the $y$ intercept, we put $x=0$ and solve for $y$.
Recently Updated Pages
Master Class 12 Economics: Engaging Questions & Answers for Success
Master Class 12 English: Engaging Questions & Answers for Success
Master Class 12 Social Science: Engaging Questions & Answers for Success
Master Class 12 Maths: Engaging Questions & Answers for Success
Master Class 12 Physics: Engaging Questions & Answers for Success
Master Class 9 General Knowledge: Engaging Questions & Answers for Success
Trending doubts
Explain the Treaty of Vienna of 1815 class 10 social science CBSE
Why is it 530 pm in india when it is 1200 afternoon class 10 social science CBSE
What is the full form of POSCO class 10 social science CBSE
Define Potential, Developed, Stock and Reserved resources
Which Country Has the Largest Border with India?
Complete the sentence with the most appropriate word class 10 english CBSE