


How do you graph $y=0x+3$ ?
Answer
588.6k+ views
Hint: The above question requires us to plot the graph of the linear equation $y=0x+3$ . We can do this by multiple methods, which include finding the points and then drawing the graph of the given line or we can write the equation in the slope-intercept form and find the points that lie on the same line.
Complete step by step solution:
Given the equation of the line is: $y=0x+3$
Let us compare the given equation to the general form of a line in the slope-intercept form, which is given by $y=mx+c$, where $m$ is the slope of the line and $c$ is the intercept of the line on the $y$ - axis.
After comparing the two equations we get the slope of the line as $m=0$ and the intercept as $c=3$
Now, let us find some points to plot the graph of the given line by substituting the values of $x$ and $y$
The equation is $y=0x+3$
Let us take $x=0$ then we get the value of $y=3$
Similarly, if we take $x=1$ then we get the value of $y=3$
For the value of $x=2$ also, we get the value of $y=3$
From the above values, we can conclude that for every value of $x$ we get the value of $y$ as $y=3$
Now, taking the points we have calculated, plot the graph for the given equation.
The graph of the equation is given below, where the blue line represents the line.
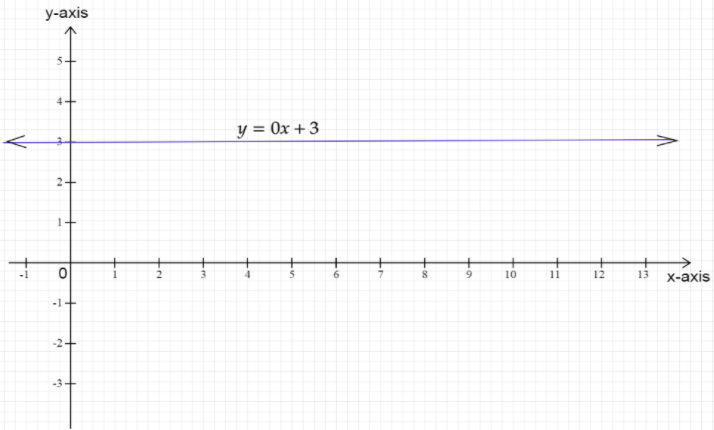
Note: From the graph, we can see that the given equation of a line represents a line that is parallel to the $x$- axis. Therefore, if ever equations like $y=c$ or $x=c$ are given, where $c$ means a constant, then on plotting the equation we will always get a parallel line to $x$- axis or $y$- axis respectively.
Complete step by step solution:
Given the equation of the line is: $y=0x+3$
Let us compare the given equation to the general form of a line in the slope-intercept form, which is given by $y=mx+c$, where $m$ is the slope of the line and $c$ is the intercept of the line on the $y$ - axis.
After comparing the two equations we get the slope of the line as $m=0$ and the intercept as $c=3$
Now, let us find some points to plot the graph of the given line by substituting the values of $x$ and $y$
The equation is $y=0x+3$
Let us take $x=0$ then we get the value of $y=3$
Similarly, if we take $x=1$ then we get the value of $y=3$
For the value of $x=2$ also, we get the value of $y=3$
From the above values, we can conclude that for every value of $x$ we get the value of $y$ as $y=3$
Now, taking the points we have calculated, plot the graph for the given equation.
The graph of the equation is given below, where the blue line represents the line.
Note: From the graph, we can see that the given equation of a line represents a line that is parallel to the $x$- axis. Therefore, if ever equations like $y=c$ or $x=c$ are given, where $c$ means a constant, then on plotting the equation we will always get a parallel line to $x$- axis or $y$- axis respectively.
Recently Updated Pages
Master Class 11 English: Engaging Questions & Answers for Success
Master Class 11 Physics: Engaging Questions & Answers for Success
Master Class 11 Computer Science: Engaging Questions & Answers for Success
Master Class 11 Chemistry: Engaging Questions & Answers for Success
Master Class 11 Social Science: Engaging Questions & Answers for Success
Master Class 11 Accountancy: Engaging Questions & Answers for Success
Trending doubts
Difference Between Prokaryotic Cells and Eukaryotic Cells
Two of the body parts which do not appear in MRI are class 11 biology CBSE
One Metric ton is equal to kg A 10000 B 1000 C 100 class 11 physics CBSE
10 examples of friction in our daily life
Draw a diagram of nephron and explain its structur class 11 biology CBSE
Draw a diagram of a plant cell and label at least eight class 11 biology CBSE