


How do you graph \[y = {x^2} - 4\] ?
Answer
603.6k+ views
Hint: Here we have to plot a graph. In this given equation by giving the values to the x like 0, 1, 2, 3, … simultaneously we get the values of y with respect to the x value. After getting the x and y values, write the coordinates of the given equation in the form of (x,y), by using the coordinates construct the required graph of the given equation.
Complete step-by-step answer:
Given equation in the form of linear equation in the form of two variables x and y
Consider the equation \[y = {x^2} - 4\]
Now, by giving the x values … -3, -2, -1, 0, 1, 2, 3, … to the above equation simultaneously we get the values of y
When we substitute the value of x=-3, then
\[ \Rightarrow y = {\left( { - 3} \right)^2} - 4\]
\[ \Rightarrow y = 9 - 4\]
\[\therefore y = 5\]
Therefore, co-ordinate \[\left( {x,y} \right) = \left( { - 3,5} \right)\]
When we substitute the value of x=-2
\[ \Rightarrow y = {\left( { - 2} \right)^2} - 4\]
\[ \Rightarrow y = 4 - 4\]
\[\therefore y = 0\]
Therefore, co-ordinate \[\left( {x,y} \right) = \left( { - 2,0} \right)\]
When we substitute the value of x=-1
\[ \Rightarrow y = {\left( { - 1} \right)^2} - 4\]
\[ \Rightarrow y = 1 - 4\]
\[\therefore y = - 3\]
Therefore, co-ordinate \[\left( {x,y} \right) = \left( { - 1, - 3} \right)\]
When we substitute the value of x=0
\[ \Rightarrow y = {\left( 0 \right)^2} - 4\]
\[ \Rightarrow y = 0 - 4\]
\[\therefore y = - 4\]
Therefore, co-ordinate \[\left( {x,y} \right) = \left( {0, - 4} \right)\]
When we substitute the value of x=1
\[ \Rightarrow y = {\left( 1 \right)^2} - 4\]
\[ \Rightarrow y = 1 - 4\]
\[\therefore y = - 3\]
Therefore, co-ordinate \[\left( {x,y} \right) = \left( {1, - 3} \right)\]
When we substitute the value of x=2
\[ \Rightarrow y = {\left( 2 \right)^2} - 4\]
\[ \Rightarrow y = 4 - 4\]
\[\therefore y = 0\]
Therefore, co-ordinate \[\left( {x,y} \right) = \left( {2,0} \right)\]
When we substitute the value of x=3, then
\[ \Rightarrow y = {\left( 3 \right)^2} - 4\]
\[ \Rightarrow y = 9 - 4\]
\[\therefore y = 5\]
Therefore, co-ordinate \[\left( {x,y} \right) = \left( {3,5} \right)\]
And so on …
Hence by substituting the value of x we have determined some of the values or points we use to plot the graph.
The coordinates can be written in table as :
Hence, the graph of the given linear equation \[y = {x^2} - 4\] represent the parabola is given by
Note: The question belongs to the concept of graph. By comparing the given equation to the equation of a line we calculate the slope and intercept. Or by choosing the value of x we can determine the value of y and then plotting the graphs for these points we obtain the result.
Complete step-by-step answer:
Given equation in the form of linear equation in the form of two variables x and y
Consider the equation \[y = {x^2} - 4\]
Now, by giving the x values … -3, -2, -1, 0, 1, 2, 3, … to the above equation simultaneously we get the values of y
When we substitute the value of x=-3, then
\[ \Rightarrow y = {\left( { - 3} \right)^2} - 4\]
\[ \Rightarrow y = 9 - 4\]
\[\therefore y = 5\]
Therefore, co-ordinate \[\left( {x,y} \right) = \left( { - 3,5} \right)\]
When we substitute the value of x=-2
\[ \Rightarrow y = {\left( { - 2} \right)^2} - 4\]
\[ \Rightarrow y = 4 - 4\]
\[\therefore y = 0\]
Therefore, co-ordinate \[\left( {x,y} \right) = \left( { - 2,0} \right)\]
When we substitute the value of x=-1
\[ \Rightarrow y = {\left( { - 1} \right)^2} - 4\]
\[ \Rightarrow y = 1 - 4\]
\[\therefore y = - 3\]
Therefore, co-ordinate \[\left( {x,y} \right) = \left( { - 1, - 3} \right)\]
When we substitute the value of x=0
\[ \Rightarrow y = {\left( 0 \right)^2} - 4\]
\[ \Rightarrow y = 0 - 4\]
\[\therefore y = - 4\]
Therefore, co-ordinate \[\left( {x,y} \right) = \left( {0, - 4} \right)\]
When we substitute the value of x=1
\[ \Rightarrow y = {\left( 1 \right)^2} - 4\]
\[ \Rightarrow y = 1 - 4\]
\[\therefore y = - 3\]
Therefore, co-ordinate \[\left( {x,y} \right) = \left( {1, - 3} \right)\]
When we substitute the value of x=2
\[ \Rightarrow y = {\left( 2 \right)^2} - 4\]
\[ \Rightarrow y = 4 - 4\]
\[\therefore y = 0\]
Therefore, co-ordinate \[\left( {x,y} \right) = \left( {2,0} \right)\]
When we substitute the value of x=3, then
\[ \Rightarrow y = {\left( 3 \right)^2} - 4\]
\[ \Rightarrow y = 9 - 4\]
\[\therefore y = 5\]
Therefore, co-ordinate \[\left( {x,y} \right) = \left( {3,5} \right)\]
And so on …
Hence by substituting the value of x we have determined some of the values or points we use to plot the graph.
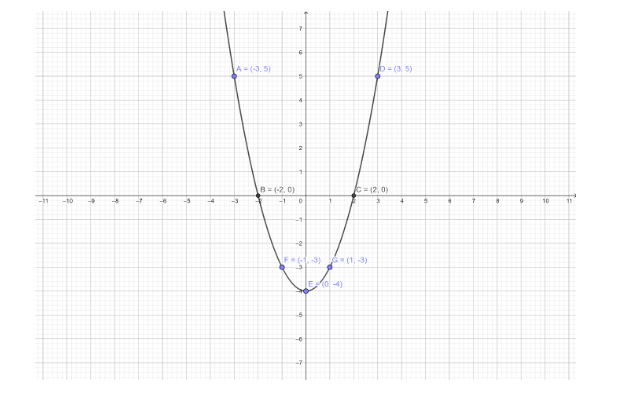
The coordinates can be written in table as :
| \[x\] | \[ - 3\] | \[ - 2\] | \[ - 1\] | \[0\] | \[1\] | \[2\] | \[3\] |
| \[y\] | \[5\] | \[0\] | \[ - 3\] | \[ - 4\] | \[ - 3\] | \[0\] | \[5\] |
| \[\left( {x,y} \right)\] | \[\left( { - 3,5} \right)\] | \[\left( { - 2,0} \right)\] | \[\left( { - 1, - 3} \right)\] | \[\left( {0, - 4} \right)\] | \[\left( {1, - 3} \right)\] | \[\left( {2,0} \right)\] | \[\left( {3,5} \right)\] |
Hence, the graph of the given linear equation \[y = {x^2} - 4\] represent the parabola is given by
Note: The question belongs to the concept of graph. By comparing the given equation to the equation of a line we calculate the slope and intercept. Or by choosing the value of x we can determine the value of y and then plotting the graphs for these points we obtain the result.

Recently Updated Pages
Master Class 9 General Knowledge: Engaging Questions & Answers for Success
Master Class 9 Maths: Engaging Questions & Answers for Success
Master Class 9 Science: Engaging Questions & Answers for Success
Master Class 9 English: Engaging Questions & Answers for Success
Master Class 9 Social Science: Engaging Questions & Answers for Success
Class 9 Question and Answer - Your Ultimate Solutions Guide
Trending doubts
Difference Between Plant Cell and Animal Cell
Fill the blanks with the suitable prepositions 1 The class 9 english CBSE
What is pollution? How many types of pollution? Define it
Name 10 Living and Non living things class 9 biology CBSE
What is the full form of pH?
On an outline map of India show its neighbouring c class 9 social science CBSE