


How do you graph $y = - {x^2} + x + 12$ ?
Answer
573.6k+ views
Hint: First we have to factorize the given expression. Then, we do some simplification; we will find the coordinates of the given equation and marked in the graph. Then we have to join the point to draw a graph of quadratic equations. Finally we get the required answer.
Complete step-by-step solution:
Here the given equation $y = - {x^2} + x + 12$ is a quadratic equation which is also known as parabola because there is an ${x^2}$ term.
Because the ${x^2}$ term is negative, we know the parabola is in the shape of a downwards.
First, to find out where the parabola crosses the $y$ axis, we set $x$ equal to $0$ and solve for $y$ :
$ \Rightarrow y = - {x^2} + x + 12$
Putting $x = 0$ we get,
$ \Rightarrow y = 0 + 0 + 12$
$ \Rightarrow y = 12$
The coordinate point is $A\left( {0,12} \right)$ .
Next, let’s find the two places where the graph intersects the $x$ axis. To do so, we set the function equal to $0$ and factor:
$ \Rightarrow - {x^2} + x + 12 = 0$
Multiply $ - 1$ to both sides we get,
$ \Rightarrow {x^2} - x - 12 = 0$
Find the factor using factorization method we get,
\[\begin{array}{*{20}{c}}
{\,\,\,\,\,\,\, - 12} \\
{\,\,\,\, \swarrow - 1 \searrow } \\
{ - 4\,\,\,\,\,\,\,\,\,\,\,\,\,\,\,\,3}
\end{array}\]
Since $ - 4 + 3 = - 1\,\,,\,\,\left( { - 4} \right)\left( 3 \right) = - 12$
Therefore the factors are $ \Rightarrow {x^2} - x - 12 = \left( {x - 4} \right)\left( {x + 3} \right) = 0$
Hence the root is $x = 4\,\,,\,\,x = - 3$
There the coordinate point is $B\left( {4,0} \right)\,,\,\,C\left( { - 3,0} \right)$
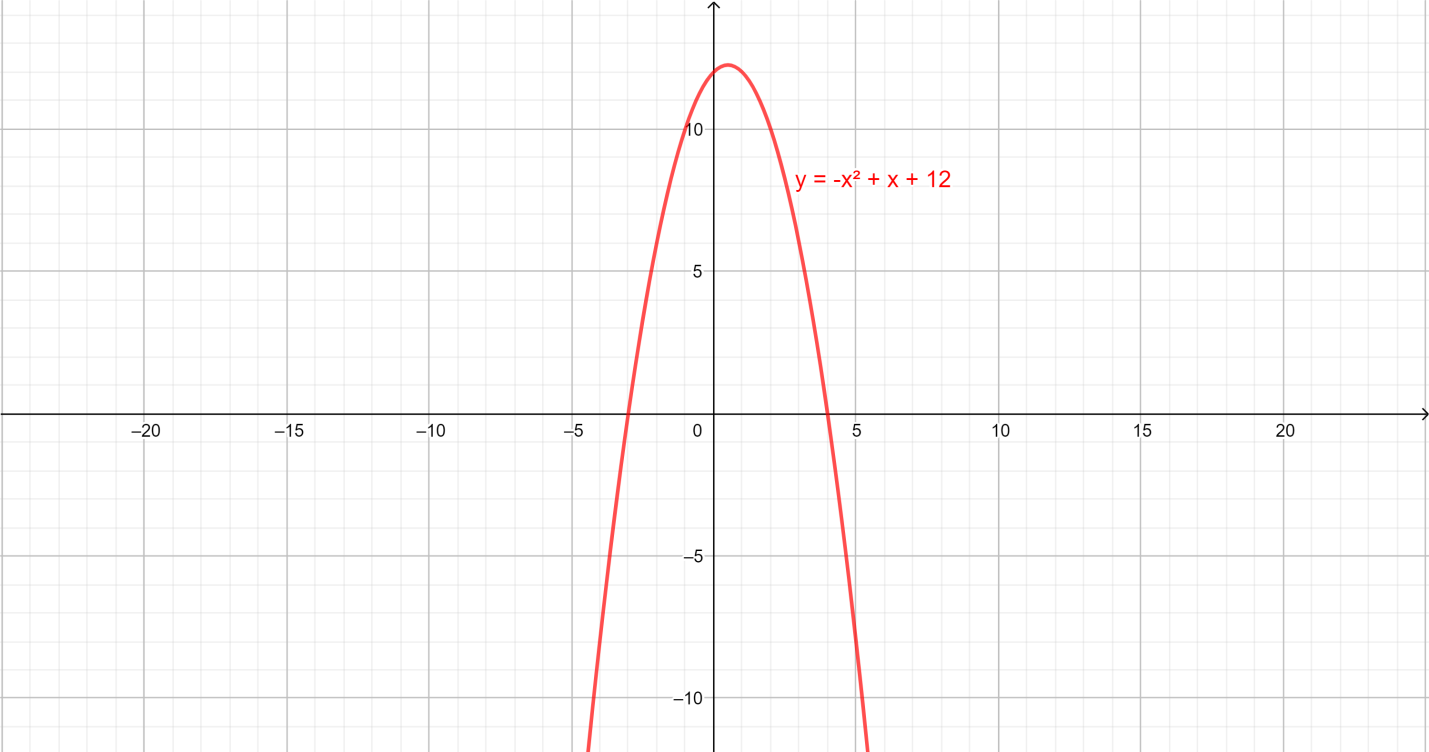
So the parabola crosses the $x$ axis and $ - 3$ and $4$. Now we know three points for certain:
$\left( {0,12} \right)$ --where it crosses the $y$ axis.
$\left( {4,0} \right)$ --one of the $x$ axis crossing.
$\left( { - 3,0} \right)$ --other $x$ axis crossing.
So that should be enough information to draw the graph.
Note: A quadratic function has the general form $y = a{x^2} + bx + c$ represented graphically by a curve called parabola that has a shape of a downwards or upwards. The main features of this curve are:
Concavity: up or down. This depends upon the sign of the real number $a$
Vertex: the vertex is the highest or lowest point of the parabola.
Point of intercept with the $y$ axis this is the point where the crosses the $y$ axis and has coordinates:$\left( {0,c} \right)$
Possible points of intercept with the $x$ axis. These are the points where the parabola crosses the $x$ axis.
They are obtained by putting $y = 0$ and solving for $x$ the second degree equation: $a{x^2} + bx + c = 0$, which will give the $x$ coordinates of these points. Depending on the discriminant $\Delta = {b^2} - 4ac$ if it is $ < 0$ the parabola does not cross the $x$ axis.
Complete step-by-step solution:
Here the given equation $y = - {x^2} + x + 12$ is a quadratic equation which is also known as parabola because there is an ${x^2}$ term.
Because the ${x^2}$ term is negative, we know the parabola is in the shape of a downwards.
First, to find out where the parabola crosses the $y$ axis, we set $x$ equal to $0$ and solve for $y$ :
$ \Rightarrow y = - {x^2} + x + 12$
Putting $x = 0$ we get,
$ \Rightarrow y = 0 + 0 + 12$
$ \Rightarrow y = 12$
The coordinate point is $A\left( {0,12} \right)$ .
Next, let’s find the two places where the graph intersects the $x$ axis. To do so, we set the function equal to $0$ and factor:
$ \Rightarrow - {x^2} + x + 12 = 0$
Multiply $ - 1$ to both sides we get,
$ \Rightarrow {x^2} - x - 12 = 0$
Find the factor using factorization method we get,
\[\begin{array}{*{20}{c}}
{\,\,\,\,\,\,\, - 12} \\
{\,\,\,\, \swarrow - 1 \searrow } \\
{ - 4\,\,\,\,\,\,\,\,\,\,\,\,\,\,\,\,3}
\end{array}\]
Since $ - 4 + 3 = - 1\,\,,\,\,\left( { - 4} \right)\left( 3 \right) = - 12$
Therefore the factors are $ \Rightarrow {x^2} - x - 12 = \left( {x - 4} \right)\left( {x + 3} \right) = 0$
Hence the root is $x = 4\,\,,\,\,x = - 3$
There the coordinate point is $B\left( {4,0} \right)\,,\,\,C\left( { - 3,0} \right)$
So the parabola crosses the $x$ axis and $ - 3$ and $4$. Now we know three points for certain:
$\left( {0,12} \right)$ --where it crosses the $y$ axis.
$\left( {4,0} \right)$ --one of the $x$ axis crossing.
$\left( { - 3,0} \right)$ --other $x$ axis crossing.
So that should be enough information to draw the graph.
Note: A quadratic function has the general form $y = a{x^2} + bx + c$ represented graphically by a curve called parabola that has a shape of a downwards or upwards. The main features of this curve are:
Concavity: up or down. This depends upon the sign of the real number $a$
Vertex: the vertex is the highest or lowest point of the parabola.
Point of intercept with the $y$ axis this is the point where the crosses the $y$ axis and has coordinates:$\left( {0,c} \right)$
Possible points of intercept with the $x$ axis. These are the points where the parabola crosses the $x$ axis.
They are obtained by putting $y = 0$ and solving for $x$ the second degree equation: $a{x^2} + bx + c = 0$, which will give the $x$ coordinates of these points. Depending on the discriminant $\Delta = {b^2} - 4ac$ if it is $ < 0$ the parabola does not cross the $x$ axis.
Recently Updated Pages
Master Class 12 Business Studies: Engaging Questions & Answers for Success
Master Class 12 Biology: Engaging Questions & Answers for Success
Master Class 12 Chemistry: Engaging Questions & Answers for Success
Class 12 Question and Answer - Your Ultimate Solutions Guide
Master Class 11 Social Science: Engaging Questions & Answers for Success
Master Class 11 English: Engaging Questions & Answers for Success
Trending doubts
Explain the Treaty of Vienna of 1815 class 10 social science CBSE
Which Indian city is known as the "City of Victory"?
Which instrument is used to measure the Blood Pressure?
Who Won 36 Oscar Awards? Record Holder Revealed
What is the median of the first 10 natural numbers class 10 maths CBSE
Why is it 530 pm in india when it is 1200 afternoon class 10 social science CBSE