


How do you graph $ y = {x^2} + 1 $ ?
Answer
579.6k+ views
Hint: To graph the above equation find the turning point of the parabola by putting $ x = 0 $ and find some ordered pairs and reflect them on the graph to obtain the desired parabola.
Complete step-by-step answer:
Given a equation $ y = {x^2} + 1 $ -(1)
Since We’ve given a x squared equation so the graph to the equation is no longer a straight line. In this case it is quadratic as x is raised to the power 2 .
So, we expect the graph of this equation to look like a parabola.
First we’ll find the turning point of the graph .So to find the turning point of the graph put
$
{x^2} = 0 \\
x = 0 \;
$
Now substituting the x in equation (1)
$
y = {0^2} + 1 \\
y = 1 \;
$
So our turning point is when x equals 0 and y equal to 1 when our parabola start turning into opposite direction.
Let’s find some of the ordered pairs that we will plot on the graph on one side of the turning point
Since we have the turning point of the parabola we can simply reflect these ordered pair in order to get our full parabola .
Therefore , above is the above to the equation $ y = {x^2} + 1 $
Note: 1. Cartesian Plane: A Cartesian Plane is given its name by the French mathematician Rene Descartes ,who first used this plane in the field of mathematics .It is defined as the two mutually perpendicular number line , the one which is horizontal is given name x-axis and the one which is vertical is known as y-axis. With the help of these axes we can plot any point on this cartesian plane with the help of an ordered pair of numbers.
2.Draw the cartesian plane only with the help of a straight ruler and pencil to get the perfect and accurate results.
Complete step-by-step answer:
Given a equation $ y = {x^2} + 1 $ -(1)
Since We’ve given a x squared equation so the graph to the equation is no longer a straight line. In this case it is quadratic as x is raised to the power 2 .
So, we expect the graph of this equation to look like a parabola.
First we’ll find the turning point of the graph .So to find the turning point of the graph put
$
{x^2} = 0 \\
x = 0 \;
$
Now substituting the x in equation (1)
$
y = {0^2} + 1 \\
y = 1 \;
$
So our turning point is when x equals 0 and y equal to 1 when our parabola start turning into opposite direction.
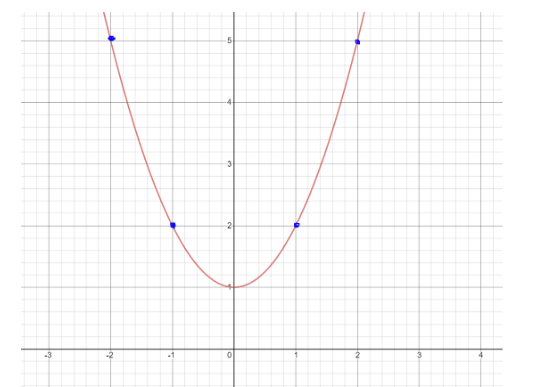
Let’s find some of the ordered pairs that we will plot on the graph on one side of the turning point
| X | 1 | 2 |
| y | 2 | 5 |
Since we have the turning point of the parabola we can simply reflect these ordered pair in order to get our full parabola .
Therefore , above is the above to the equation $ y = {x^2} + 1 $
Note: 1. Cartesian Plane: A Cartesian Plane is given its name by the French mathematician Rene Descartes ,who first used this plane in the field of mathematics .It is defined as the two mutually perpendicular number line , the one which is horizontal is given name x-axis and the one which is vertical is known as y-axis. With the help of these axes we can plot any point on this cartesian plane with the help of an ordered pair of numbers.
2.Draw the cartesian plane only with the help of a straight ruler and pencil to get the perfect and accurate results.

Recently Updated Pages
Master Class 9 Social Science: Engaging Questions & Answers for Success
Master Class 9 Science: Engaging Questions & Answers for Success
Master Class 9 Maths: Engaging Questions & Answers for Success
Master Class 9 General Knowledge: Engaging Questions & Answers for Success
Class 9 Question and Answer - Your Ultimate Solutions Guide
Master Class 8 Social Science: Engaging Questions & Answers for Success
Trending doubts
Find the sum of series 1 + 2 + 3 + 4 + 5 + + 100 class 9 maths CBSE
What is the Full Form of ISI and RAW
Fill the blanks with the suitable prepositions 1 The class 9 english CBSE
Difference Between Plant Cell and Animal Cell
Who is eligible for RTE class 9 social science CBSE
What is pollution? How many types of pollution? Define it