


How do you graph \[y = - x + 3\] and \[y = - 4x - 6?\]
Answer
554.1k+ views
Hint: Here we have to draw a graph for the given expression. Then we will plot the coordinates in the line manually, and we will try to find the values in the graph accordingly. On doing some simplification we get the required answer.
Complete step-by-step solution:
If two linear equations intersect each other at any point, then they can be solvable in the following way.
Let's say, \[n = Am + B\] and \[n = Cm + D\] are two different equations, and we want to solve for \[n,m\].
So, we can write the following equation:
\[Am + B = Cm + D\]
By solving it, we get:
\[Am - Cm = D - B\]
\[ \Rightarrow (A - C)m = (D - B).\]
Now, simplify it, we get:
\[ \Rightarrow m = \dfrac{{(D - B)}}{{(A - C)}}.\]
By putting this value in any of the above equations, we can find the value of \[n\].
So, \[n = A.\dfrac{{(D - B)}}{{(A - C)}} + B.\]
Following equations are given in the question:
\[y = - x + 3................(1)\]
\[y = - 4x - 6..............(2)\]
First of all, we will try to find, whether an intersection point exists or not.
So, by equating both the equation, we get:
\[ \Rightarrow - x + 3 = - 4x - 6\].
Now, taking variables to the L.H.S and constant terms to the R.H.S, we get:
\[ \Rightarrow - x + 4x = - 3 - 6\].
Now, divide constant terms, we get:
\[ \Rightarrow 3x = - 9\]
\[ \Rightarrow x = \dfrac{{ - 9}}{3}.\]
So, we get the value as:
\[ \Rightarrow x = - 3.\]
By putting this value to the equation \[y = - 4x - 6\], we get:
\[y = - 4 \times - 3 - 6.\]
Now, multiply the values:
\[ \Rightarrow y = 12 - 6.\]
Now, subtracting it, we get:
\[ \Rightarrow y = 6.\]
So, these two lines, \[y = - x + 3\]and \[y = - 4x - 6\] intersect each other at the point \[( - 3,6)\] in the graph.
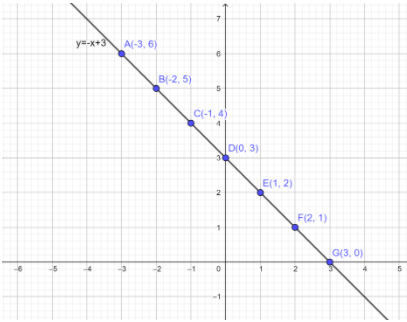
So, we will try to find the values of \[y\] in equation \[(1)\], by putting some arbitrary values of \[x = - 3, - 2, - 1,0,1,2,3\,etc.\]
So, we can write down the following chart:
\[y = - x + 3................(1)\]
So, if we put these values to the graph, we get the following line:
Now, we will try to find the values of \[y\] in equation \[(2)\], by putting some arbitrary values of \[x = - 3, - 2, - 1,0,1,2,3etc.\]
So, we can draw the following chart:
\[y = - 4x - 6..............(2)\]
Now, if we put these values to the above graph, we get the following two lines:
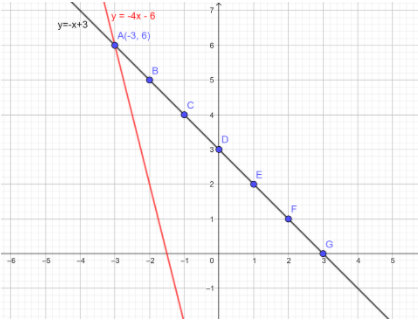
\[\therefore \]The above graph is the final graph for the given question.
Note: Points to remember:
If two following equations are given:
\[{a_1}{x^2} + {b_1}x + {c_1} = 0\]
\[{a_2}{x^2} + {b_2}x + {c_2} = 0\]
Then, these two lines will be parallel, if
\[\dfrac{{{a_1}}}{{{a_2}}} = \dfrac{{{b_1}}}{{b{}_2}} \ne \dfrac{{{c_1}}}{{{c_2}}}\].
Therefore, to plot the two lines in the graph we need to know first whether these two lines are parallel or they have any intersection points.
Put these points in the equation and find that this point fits the equation or not.
Then take some positive or negative coordinates to draw the line.
Complete step-by-step solution:
If two linear equations intersect each other at any point, then they can be solvable in the following way.
Let's say, \[n = Am + B\] and \[n = Cm + D\] are two different equations, and we want to solve for \[n,m\].
So, we can write the following equation:
\[Am + B = Cm + D\]
By solving it, we get:
\[Am - Cm = D - B\]
\[ \Rightarrow (A - C)m = (D - B).\]
Now, simplify it, we get:
\[ \Rightarrow m = \dfrac{{(D - B)}}{{(A - C)}}.\]
By putting this value in any of the above equations, we can find the value of \[n\].
So, \[n = A.\dfrac{{(D - B)}}{{(A - C)}} + B.\]
Following equations are given in the question:
\[y = - x + 3................(1)\]
\[y = - 4x - 6..............(2)\]
First of all, we will try to find, whether an intersection point exists or not.
So, by equating both the equation, we get:
\[ \Rightarrow - x + 3 = - 4x - 6\].
Now, taking variables to the L.H.S and constant terms to the R.H.S, we get:
\[ \Rightarrow - x + 4x = - 3 - 6\].
Now, divide constant terms, we get:
\[ \Rightarrow 3x = - 9\]
\[ \Rightarrow x = \dfrac{{ - 9}}{3}.\]
So, we get the value as:
\[ \Rightarrow x = - 3.\]
By putting this value to the equation \[y = - 4x - 6\], we get:
\[y = - 4 \times - 3 - 6.\]
Now, multiply the values:
\[ \Rightarrow y = 12 - 6.\]
Now, subtracting it, we get:
\[ \Rightarrow y = 6.\]
So, these two lines, \[y = - x + 3\]and \[y = - 4x - 6\] intersect each other at the point \[( - 3,6)\] in the graph.
So, we will try to find the values of \[y\] in equation \[(1)\], by putting some arbitrary values of \[x = - 3, - 2, - 1,0,1,2,3\,etc.\]
So, we can write down the following chart:
\[y = - x + 3................(1)\]
| \[x\] | \[ - 3\] | \[ - 2\] | \[ - 1\] | \[0\] | \[1\] | \[2\] | \[3\] |
| \[y\] | \[6\] | \[5\] | \[4\] | \[3\] | \[2\] | \[1\] | \[0\] |
So, if we put these values to the graph, we get the following line:
Now, we will try to find the values of \[y\] in equation \[(2)\], by putting some arbitrary values of \[x = - 3, - 2, - 1,0,1,2,3etc.\]
So, we can draw the following chart:
\[y = - 4x - 6..............(2)\]
| \[x\] | \[ - 3\] | \[ - 2\] | \[ - 1\] | \[0\] | \[1\] | \[2\] | \[3\] |
| \[y\] | \[6\] | \[2\] | \[ - 2\] | \[ - 6\] | \[ - 10\] | \[ - 14\] | \[ - 18\] |
Now, if we put these values to the above graph, we get the following two lines:
\[\therefore \]The above graph is the final graph for the given question.
Note: Points to remember:
If two following equations are given:
\[{a_1}{x^2} + {b_1}x + {c_1} = 0\]
\[{a_2}{x^2} + {b_2}x + {c_2} = 0\]
Then, these two lines will be parallel, if
\[\dfrac{{{a_1}}}{{{a_2}}} = \dfrac{{{b_1}}}{{b{}_2}} \ne \dfrac{{{c_1}}}{{{c_2}}}\].
Therefore, to plot the two lines in the graph we need to know first whether these two lines are parallel or they have any intersection points.
Put these points in the equation and find that this point fits the equation or not.
Then take some positive or negative coordinates to draw the line.

Recently Updated Pages
Master Class 8 Social Science: Engaging Questions & Answers for Success
Master Class 8 English: Engaging Questions & Answers for Success
Class 8 Question and Answer - Your Ultimate Solutions Guide
Master Class 8 Maths: Engaging Questions & Answers for Success
Master Class 8 Science: Engaging Questions & Answers for Success
Master Class 9 General Knowledge: Engaging Questions & Answers for Success
Trending doubts
What is BLO What is the full form of BLO class 8 social science CBSE
Citizens of India can vote at the age of A 18 years class 8 social science CBSE
Full form of STD, ISD and PCO
Advantages and disadvantages of science
Right to vote is a AFundamental Right BFundamental class 8 social science CBSE
What are the 12 elements of nature class 8 chemistry CBSE