


How do you graph \[y = \sqrt {x + 1} \].
Answer
555k+ views
Hint:To draw the graph we need to find out the coordinates. To find the coordinates we have to put random values of x to get values of y. So, that we get the coordinates in the form \[(x, y)\] we can take any number of values but it should be more than or equal to 2 because we need at least two points to sketch the graph. The more the number of points is more accurate the graph will be. This equation is not a linear equation but it seems to be like a parabolic equation so by plotting the graph we can obtain the parabolic graph.
Step by Step Solution:
Given equation \[y = \sqrt {x + 1} \]…………………………. (i)
Now, we will choose random value of x and put in equation (i) to get the values of y
Firstly, we choose $x=1$ and put this value in equation $\left(i \right)$ and we get y as $y= \sqrt{1+1} \Rightarrow \sqrt{2}$
Again put $x=2$ in equation $\left(i \right)$ we get y as $y= \sqrt{2+1} \Rightarrow \sqrt{3}$
So, we get the coordinate as \[(1,\sqrt 2 ){\rm{ }}\,and\,{\rm{ }}(2,\sqrt 3 )\],both the points lie on the first quadrant.
Now, we will put these points in the x-y plane and obtain the graph.
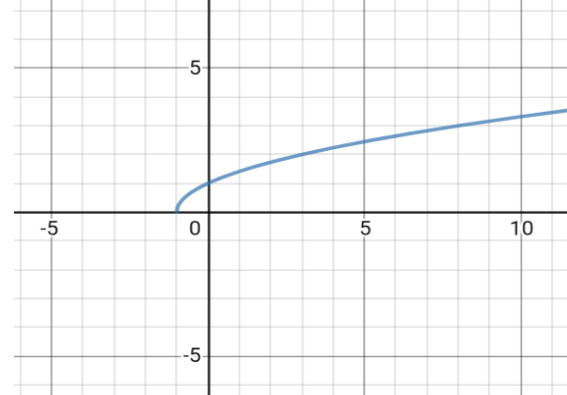
Note: We must take care that values of x & y must be a real number so that we can plot them. To get real values of y, x must be greater than or equal to -1, otherwise, y will be imaginary. we cannot be able to plot imaginary numbers on the x-y plane. To plot the graph more accurately we can take 4 to 5 coordinates to plot it but we need to take care that all coordinates we have chosen must be plotted accurately on the graph and should also consider both positive as well as negative.
Step by Step Solution:
Given equation \[y = \sqrt {x + 1} \]…………………………. (i)
Now, we will choose random value of x and put in equation (i) to get the values of y
Firstly, we choose $x=1$ and put this value in equation $\left(i \right)$ and we get y as $y= \sqrt{1+1} \Rightarrow \sqrt{2}$
Again put $x=2$ in equation $\left(i \right)$ we get y as $y= \sqrt{2+1} \Rightarrow \sqrt{3}$
So, we get the coordinate as \[(1,\sqrt 2 ){\rm{ }}\,and\,{\rm{ }}(2,\sqrt 3 )\],both the points lie on the first quadrant.
Now, we will put these points in the x-y plane and obtain the graph.
Note: We must take care that values of x & y must be a real number so that we can plot them. To get real values of y, x must be greater than or equal to -1, otherwise, y will be imaginary. we cannot be able to plot imaginary numbers on the x-y plane. To plot the graph more accurately we can take 4 to 5 coordinates to plot it but we need to take care that all coordinates we have chosen must be plotted accurately on the graph and should also consider both positive as well as negative.

Recently Updated Pages
Master Class 8 Social Science: Engaging Questions & Answers for Success
Master Class 8 English: Engaging Questions & Answers for Success
Class 8 Question and Answer - Your Ultimate Solutions Guide
Master Class 8 Maths: Engaging Questions & Answers for Success
Master Class 8 Science: Engaging Questions & Answers for Success
Master Class 7 English: Engaging Questions & Answers for Success
Trending doubts
Difference Between Plant Cell and Animal Cell
Fill the blanks with the suitable prepositions 1 The class 9 english CBSE
Who is eligible for RTE class 9 social science CBSE
Which places in India experience sunrise first and class 9 social science CBSE
What is pollution? How many types of pollution? Define it
Name 10 Living and Non living things class 9 biology CBSE