


How do you graph \[y = \sin \left( { - x} \right)\]?
Answer
571.8k+ views
Hint: Here, we will find the graph for the given trigonometric equation. We will draw the graph of the given trigonometric function by taking numerical division on \[y\]-axis and radian division on the \[x\] axis. Then by substituting different angles in the place of x we will get the required points. Then by using the points we will draw the required curve. A graph is a representation and relation of two points in a line.
Formula Used:
The difference between the square of numbers is given by the formula \[{a^2} - {b^2} = \left( {a + b} \right)\left( {a - b} \right)\].
Complete step by step solution:
We are given a function \[y = \sin \left( { - x} \right)\].
We know that if the given function is \[f\left( x \right)\] then upon changing the variable as negative i.e., \[x = - x\] we get \[f\left( x \right) = f\left( { - x} \right)\] .
If \[f\left( { - x} \right) = - f\left( x \right)\] , then the graph is the mirror image of \[f\left( x \right)\] with respect to \[x\] and the function is an odd function.
Thus, the combined graph of both the functions is symmetrical about \[x\]-axis.
\[ \Rightarrow \] Graph of \[y = \sin \left( { - x} \right) = - \sin x\]
\[ \Rightarrow \] Graph of \[y + \sin x = 0\]
\[ \Rightarrow \] Graph of \[y = \sin x = \sin x\]
\[ \Rightarrow \] Graph of \[y - \sin x = 0\]
Thus, the combined graph of the given function is given by
\[ \Rightarrow \] Combined Graph of \[\left( {y + \sin x} \right)\left( {y - \sin x} \right) = 0\]
The difference between the square of numbers is given by the formula \[{a^2} - {b^2} = \left( {a + b} \right)\left( {a - b} \right)\]
\[ \Rightarrow \] Combined Graph of \[{y^2} - {\sin ^2}x = 0\]
Now, we will draw the graph of \[y = \sin x\].
We know that the Graph of\[\sin x\] is a periodic function with \[2\pi \]. So, we will draw the graph in the interval \[\left[ {0,2\pi } \right]\].
We will follow the following steps to draw the graph of \[y = \sin x\] such that
i. Draw a \[y\]-axis with the points as \[0,1,2,3,.....\]
ii. Now, we will draw an \[x\]-axis horizontal from the origin. The points are in radians such that \[\dfrac{\pi }{2},\pi ,\dfrac{{3\pi }}{2},2\pi ,........\]
The sine curve will cut the \[x\]-axis at \[\pi ,2\pi ,3\pi ,....\] since \[\sin n\pi = 0\].
We know that \[\sin x\] is an even function, so that the function \[y = - \sin x\] is a mirror image of the graph of \[y = \sin x\]. Therefore, the graph of \[y = - \sin x\] is as follows:
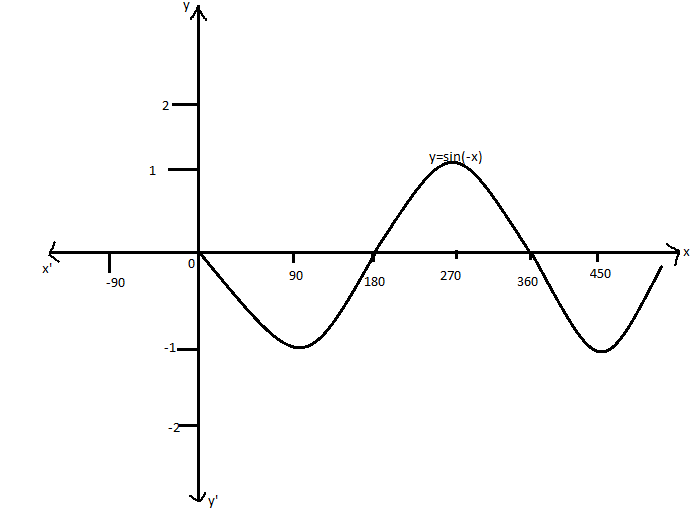
Then the combined graph is symmetrical about the \[x\] axis.
Note:
We know that we have many trigonometric identities that are related to all the other trigonometric equations. We should note in particular that sine and tangent are odd functions since both the functions are symmetric about the origin. Cosine is an even function since the function is symmetric about the y-axis. So, we take the arguments in the negative sign for odd functions and a positive sign for even function. The graph of an odd function is always the mirror image of the function.
Formula Used:
The difference between the square of numbers is given by the formula \[{a^2} - {b^2} = \left( {a + b} \right)\left( {a - b} \right)\].
Complete step by step solution:
We are given a function \[y = \sin \left( { - x} \right)\].
We know that if the given function is \[f\left( x \right)\] then upon changing the variable as negative i.e., \[x = - x\] we get \[f\left( x \right) = f\left( { - x} \right)\] .
If \[f\left( { - x} \right) = - f\left( x \right)\] , then the graph is the mirror image of \[f\left( x \right)\] with respect to \[x\] and the function is an odd function.
Thus, the combined graph of both the functions is symmetrical about \[x\]-axis.
\[ \Rightarrow \] Graph of \[y = \sin \left( { - x} \right) = - \sin x\]
\[ \Rightarrow \] Graph of \[y + \sin x = 0\]
\[ \Rightarrow \] Graph of \[y = \sin x = \sin x\]
\[ \Rightarrow \] Graph of \[y - \sin x = 0\]
Thus, the combined graph of the given function is given by
\[ \Rightarrow \] Combined Graph of \[\left( {y + \sin x} \right)\left( {y - \sin x} \right) = 0\]
The difference between the square of numbers is given by the formula \[{a^2} - {b^2} = \left( {a + b} \right)\left( {a - b} \right)\]
\[ \Rightarrow \] Combined Graph of \[{y^2} - {\sin ^2}x = 0\]
Now, we will draw the graph of \[y = \sin x\].
We know that the Graph of\[\sin x\] is a periodic function with \[2\pi \]. So, we will draw the graph in the interval \[\left[ {0,2\pi } \right]\].
We will follow the following steps to draw the graph of \[y = \sin x\] such that
i. Draw a \[y\]-axis with the points as \[0,1,2,3,.....\]
ii. Now, we will draw an \[x\]-axis horizontal from the origin. The points are in radians such that \[\dfrac{\pi }{2},\pi ,\dfrac{{3\pi }}{2},2\pi ,........\]
The sine curve will cut the \[x\]-axis at \[\pi ,2\pi ,3\pi ,....\] since \[\sin n\pi = 0\].
We know that \[\sin x\] is an even function, so that the function \[y = - \sin x\] is a mirror image of the graph of \[y = \sin x\]. Therefore, the graph of \[y = - \sin x\] is as follows:
Then the combined graph is symmetrical about the \[x\] axis.
Note:
We know that we have many trigonometric identities that are related to all the other trigonometric equations. We should note in particular that sine and tangent are odd functions since both the functions are symmetric about the origin. Cosine is an even function since the function is symmetric about the y-axis. So, we take the arguments in the negative sign for odd functions and a positive sign for even function. The graph of an odd function is always the mirror image of the function.
Recently Updated Pages
Master Class 11 Social Science: Engaging Questions & Answers for Success
Master Class 11 Physics: Engaging Questions & Answers for Success
Master Class 11 Maths: Engaging Questions & Answers for Success
Master Class 11 Economics: Engaging Questions & Answers for Success
Master Class 11 Computer Science: Engaging Questions & Answers for Success
Master Class 11 Chemistry: Engaging Questions & Answers for Success
Trending doubts
One Metric ton is equal to kg A 10000 B 1000 C 100 class 11 physics CBSE
How many bones are in the spine class 11 biology CBSE
1 Quintal is equal to a 110 kg b 10 kg c 100kg d 1000 class 11 physics CBSE
There are 720 permutations of the digits 1 2 3 4 5 class 11 maths CBSE
State and prove Bernoullis theorem class 11 physics CBSE
Difference Between Prokaryotic Cells and Eukaryotic Cells