


How do you graph $y = \sin (\dfrac{x}{2})$
Answer
582k+ views
Hint: Since this is a graphical solution, the student will have to solve for $3 - 4$ values in order to obtain the curve. The student has to substitute the known value of $y$ out of ${30^ \circ },{45^ \circ },{60^ \circ },{90^ \circ }$ in order to obtain the curve. Also, the student will have to input a negative value of $y$ so that the sine curve is also obtained on the left side of the $y - axis$. The graph so obtained would be a sin wave which would be similar to $\sin x$, having a period of $2\pi $.
Complete step by step solution:
In order to obtain the graph, let us start with the first value of $y = 1$
$1 = \sin (\dfrac{x}{2})$
Also we know that value of $\sin (\dfrac{\pi }{2}) = 1$, Thus equating both of the values
$\sin (\dfrac{\pi }{2}) = \sin (\dfrac{x}{2})$
On comparing we can say that value of $x = \pi ........(1)$
Now similarly we can use the value of $y = - 1$, and obtain the value of $x = - \pi ........(2)$
Now using $y = 0$,
Solving in the same way as above
$0 = \sin (\dfrac{x}{2})$
Since we know that value of sine function is $0$at $0,\pi ,2\pi ........$
$0 = \sin (\dfrac{x}{2})$, for this we can have values of $x = 0,2\pi ,4\pi $.
Thus from above we have following coordinates
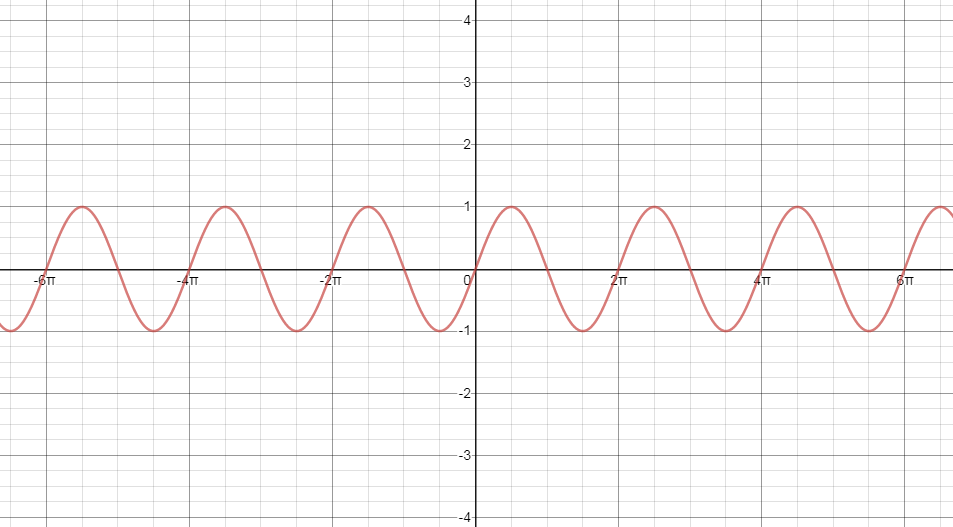
$(\pi ,1),( - \pi , - 1)(0,0)(2\pi ,0)( - 2\pi ,0)$
Using the above co-ordinates we can plot the graph of $y = \sin (\dfrac{x}{2})$. Since we are getting the value of $y = 0$, at $x = 0\& x = 2\pi $, we can say that the period of this sine wave is $2\pi $.
Note:
Even if the values are not given, students should always know the shape of the curves of each of the trigonometric functions. This is because the students may ask the sum based on the curves and equation, that is to find the frequency, wavelength of the curve. In such cases, if the student is not aware of the shape of the curve it might consume a lot of time if he/she sits and starts plotting the graph. Knowing the properties, formulae, and shape of the curves is very useful for solving trigonometric numerical.
Complete step by step solution:
In order to obtain the graph, let us start with the first value of $y = 1$
$1 = \sin (\dfrac{x}{2})$
Also we know that value of $\sin (\dfrac{\pi }{2}) = 1$, Thus equating both of the values
$\sin (\dfrac{\pi }{2}) = \sin (\dfrac{x}{2})$
On comparing we can say that value of $x = \pi ........(1)$
Now similarly we can use the value of $y = - 1$, and obtain the value of $x = - \pi ........(2)$
Now using $y = 0$,
Solving in the same way as above
$0 = \sin (\dfrac{x}{2})$
Since we know that value of sine function is $0$at $0,\pi ,2\pi ........$
$0 = \sin (\dfrac{x}{2})$, for this we can have values of $x = 0,2\pi ,4\pi $.
Thus from above we have following coordinates
$(\pi ,1),( - \pi , - 1)(0,0)(2\pi ,0)( - 2\pi ,0)$
Using the above co-ordinates we can plot the graph of $y = \sin (\dfrac{x}{2})$. Since we are getting the value of $y = 0$, at $x = 0\& x = 2\pi $, we can say that the period of this sine wave is $2\pi $.
Note:
Even if the values are not given, students should always know the shape of the curves of each of the trigonometric functions. This is because the students may ask the sum based on the curves and equation, that is to find the frequency, wavelength of the curve. In such cases, if the student is not aware of the shape of the curve it might consume a lot of time if he/she sits and starts plotting the graph. Knowing the properties, formulae, and shape of the curves is very useful for solving trigonometric numerical.
Recently Updated Pages
Master Class 11 Social Science: Engaging Questions & Answers for Success
Master Class 11 English: Engaging Questions & Answers for Success
Master Class 11 Maths: Engaging Questions & Answers for Success
Master Class 11 Chemistry: Engaging Questions & Answers for Success
Master Class 11 Biology: Engaging Questions & Answers for Success
Master Class 11 Physics: Engaging Questions & Answers for Success
Trending doubts
Differentiate between an exothermic and an endothermic class 11 chemistry CBSE
One Metric ton is equal to kg A 10000 B 1000 C 100 class 11 physics CBSE
Difference Between Prokaryotic Cells and Eukaryotic Cells
There are 720 permutations of the digits 1 2 3 4 5 class 11 maths CBSE
Two of the body parts which do not appear in MRI are class 11 biology CBSE
Which gas is abundant in air class 11 chemistry CBSE