


How do you graph $y = {\log _2}(x - 1) + 3$?
Answer
610.5k+ views
Hint: In this question we have logarithmic function; we will compare this function to the general logarithmic function and make the graph for it.
Complete step-by-step solution:
We have the given logarithmic function as:
$y = {\log _2}(x - 1) + 3$
We know the range of the logarithmic function is $x \in \mathbb{R}$, which means that the function is defined to all the real numbers which are present in the $Y$ axis.
In this question, the domain is trickier, the asymptote of the equation will be considered.
A normal asymptote will occur when we write ${\log _2}0 = \dfrac{{\log 0}}{{\log 2}}$ appears. This is the same case just like in rational functions.
We can determine the equations of any asymptotes by setting the value of the function as $0$.
For this question, we will consider $x - 1$ because it is contained by a logarithm of base $2$.
Therefore, we get:
$x - 1 = 0$
On rearranging the terms, we get:
$x = 1$
Therefore, in this case the asymptote will be a vertical asymptote at $x = 1$.
Now we will find the reflections, stretches, compressions and vertical or horizontal transformations in the given equation.
We will find the transformations when we convert the general function $y = {\log _2}x$ to the function $y = \log (x - 1) + 3$
We have calculated that there is a horizontal transformation of $1$ unit to the right, and since $3$ is added to the function, there will be a vertical transformation of $3$ units upwards.
Now that we know the transformations, we can plot the graph as:
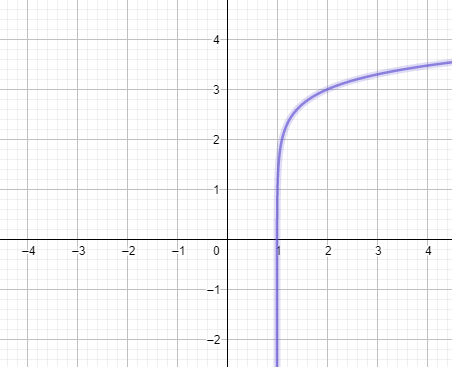
Which is the required graph to the function.
Note: Logarithm is used to simplify a mathematical expression, it converts multiplication to addition, division to subtraction and exponents to multiplication.
The most commonly used bases in logarithm are $10$ and $e$ which has a value of approximate $2.713...$
Complete step-by-step solution:
We have the given logarithmic function as:
$y = {\log _2}(x - 1) + 3$
We know the range of the logarithmic function is $x \in \mathbb{R}$, which means that the function is defined to all the real numbers which are present in the $Y$ axis.
In this question, the domain is trickier, the asymptote of the equation will be considered.
A normal asymptote will occur when we write ${\log _2}0 = \dfrac{{\log 0}}{{\log 2}}$ appears. This is the same case just like in rational functions.
We can determine the equations of any asymptotes by setting the value of the function as $0$.
For this question, we will consider $x - 1$ because it is contained by a logarithm of base $2$.
Therefore, we get:
$x - 1 = 0$
On rearranging the terms, we get:
$x = 1$
Therefore, in this case the asymptote will be a vertical asymptote at $x = 1$.
Now we will find the reflections, stretches, compressions and vertical or horizontal transformations in the given equation.
We will find the transformations when we convert the general function $y = {\log _2}x$ to the function $y = \log (x - 1) + 3$
We have calculated that there is a horizontal transformation of $1$ unit to the right, and since $3$ is added to the function, there will be a vertical transformation of $3$ units upwards.
Now that we know the transformations, we can plot the graph as:
Which is the required graph to the function.
Note: Logarithm is used to simplify a mathematical expression, it converts multiplication to addition, division to subtraction and exponents to multiplication.
The most commonly used bases in logarithm are $10$ and $e$ which has a value of approximate $2.713...$
Recently Updated Pages
Basicity of sulphurous acid and sulphuric acid are
Master Class 12 Economics: Engaging Questions & Answers for Success
Master Class 12 Biology: Engaging Questions & Answers for Success
Master Class 11 English: Engaging Questions & Answers for Success
Master Class 11 Physics: Engaging Questions & Answers for Success
Master Class 11 Computer Science: Engaging Questions & Answers for Success
Trending doubts
Difference Between Plant Cell and Animal Cell
Fill the blanks with the suitable prepositions 1 The class 9 english CBSE
What is pollution? How many types of pollution? Define it
What is the full form of pH?
What is the Full Form of ICSE, CBSE and SSC
Name 10 Living and Non living things class 9 biology CBSE