




How do you graph $ y = \dfrac{x}{2} + 3 $ ?
Answer
 Verified
605.1k+ views
Hint: In this question we are supposed to find the graph of the given equation $ y = \dfrac{x}{2} + 3 $ . The given equation is linear in order with respect to both variables $ x $ and $ y $ . To plot the graph of this equation we will first find some point i.e., pairs of $ x,y $ such that they satisfy the given equation. Then we will place these points on the X-Y plane.
Complete step-by-step solution:
In this question we need to plot the graph of equation $ y = \dfrac{x}{2} + 3 $ . To plot this equation we will first find that this equation is of line, circle or some other 2-D shapes. Since our given equation is of linear order in both the variables, so it can be the equation of a line. Because the equation of a straight line is of the form $ y = mx + c $ and our equation is $ y = \dfrac{x}{2} + 3 $ .
In our equation we have $ m = \dfrac{1}{2} $ and $ c = 3 $ . Since the given equation $ y = \dfrac{x}{2} + 3 $ is of a straight line.
Now, we will find some point which lies on the given equation by putting the value of $ x $ and $ y $ respectively.
$ y = \dfrac{x}{2} + 3 $ $ eq(1) $
Let us take $ x = 0 $ then value of $ x $ in $ eq(1) $ , we get $ y = 3 $ .
Similarly, Let us take $ x = 1 $ then value of $ x $ in $ eq(1) $ , we get $ y = \dfrac{7}{2} $ .
Similarly, Let us take $ x = 2 $ then the value of $ x $ in $ eq(1) $ , we get $ y = 4 $ .
Similarly, Let us take $ x = - 1 $ then value of $ x $ in $ eq(1) $ , we get $ y = \dfrac{5}{2} $ .
Similarly, Let us take $ x = - 2 $ then value of $ x $ in $ eq(1) $ , we get $ y = 2 $ .Now we have some points which lies on $ y = \dfrac{x}{2} + 3 $ , here is the graph
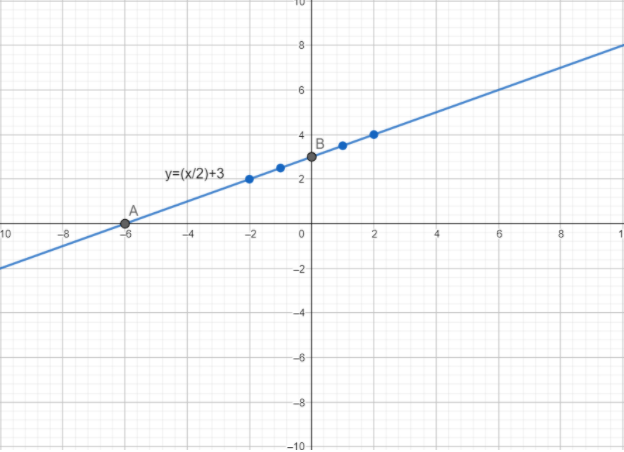
These blue dots are the above points which we find by assuming the value of $ x $
Note: To check whether your graph is correct or not just take any point from the line put in the given equation, if it satisfies then your plotted graph is correct. For example: $(6,6)$ is a point on the line. Putting $(6,6)$ in the equation$y = \dfrac{x}{2} + 3$, we get
$
6 = \dfrac{6}{2} + 3 \\
6 = 3 + 3 \\
6 = 6 \\
LHS = RHS \\
$
Hence the plotted graph of equation$y = \dfrac{x}{2} + 3$ is correct.
Complete step-by-step solution:
In this question we need to plot the graph of equation $ y = \dfrac{x}{2} + 3 $ . To plot this equation we will first find that this equation is of line, circle or some other 2-D shapes. Since our given equation is of linear order in both the variables, so it can be the equation of a line. Because the equation of a straight line is of the form $ y = mx + c $ and our equation is $ y = \dfrac{x}{2} + 3 $ .
In our equation we have $ m = \dfrac{1}{2} $ and $ c = 3 $ . Since the given equation $ y = \dfrac{x}{2} + 3 $ is of a straight line.
Now, we will find some point which lies on the given equation by putting the value of $ x $ and $ y $ respectively.
$ y = \dfrac{x}{2} + 3 $ $ eq(1) $
Let us take $ x = 0 $ then value of $ x $ in $ eq(1) $ , we get $ y = 3 $ .
Similarly, Let us take $ x = 1 $ then value of $ x $ in $ eq(1) $ , we get $ y = \dfrac{7}{2} $ .
Similarly, Let us take $ x = 2 $ then the value of $ x $ in $ eq(1) $ , we get $ y = 4 $ .
Similarly, Let us take $ x = - 1 $ then value of $ x $ in $ eq(1) $ , we get $ y = \dfrac{5}{2} $ .
Similarly, Let us take $ x = - 2 $ then value of $ x $ in $ eq(1) $ , we get $ y = 2 $ .Now we have some points which lies on $ y = \dfrac{x}{2} + 3 $ , here is the graph
These blue dots are the above points which we find by assuming the value of $ x $
Note: To check whether your graph is correct or not just take any point from the line put in the given equation, if it satisfies then your plotted graph is correct. For example: $(6,6)$ is a point on the line. Putting $(6,6)$ in the equation$y = \dfrac{x}{2} + 3$, we get
$
6 = \dfrac{6}{2} + 3 \\
6 = 3 + 3 \\
6 = 6 \\
LHS = RHS \\
$
Hence the plotted graph of equation$y = \dfrac{x}{2} + 3$ is correct.
Recently Updated Pages
Basicity of sulphurous acid and sulphuric acid are

Master Class 10 Computer Science: Engaging Questions & Answers for Success
Master Class 10 Social Science: Engaging Questions & Answers for Success
Master Class 10 Science: Engaging Questions & Answers for Success
Class 10 Question and Answer - Your Ultimate Solutions Guide
Master Class 10 Maths: Engaging Questions & Answers for Success
Trending doubts
What is the Total Duration of Football Match?
In football, which nation is called "La Roja"?
Why is there a time difference of about 5 hours between class 10 social science CBSE
What is the award for the best player at the FIFA World Cup?
Define Potential, Developed, Stock and Reserved resources
Draw the diagram of the sectional view of the human class 10 biology CBSE