


How do you graph $y = \dfrac{8}{3}x - 3$?
Answer
562.5k+ views
Hint: Plotting a graph depends on the type of equation we have. A linear equation will always give a straight line, while a quadratic equation gives a parabolic shape. In the problem we have a linear equation, so we will get a straight line in the graph. For drawing a straight line, we need to have at least two points that satisfy the given linear equation. For finding the two points which satisfy the given line we need to take two points in the coordinate system like $\left( {a,0} \right)$ and $\left( {0,b} \right)$. Now we will substitute the points in the given equation and calculate the values of $a$ and $b$. Then take a minimum of 5 points and plot the points. After plotting the points, join the points with a smooth freehand curve and identify the curve that we have obtained.
Complete step by step solution:
We know that the graph of a function is the locus of points $\left( {x,y} \right)$ such that $y = f\left( x \right)$ where x, y are real numbers. We are given the following quadratic polynomial function,
$ \Rightarrow y = \dfrac{8}{3}x - 3$
So, let us put $y = 0$ and find the x-intercept. We have,
$ \Rightarrow 0 = \dfrac{8}{3}x - 3$
Move constant term on the other side,
$ \Rightarrow \dfrac{8}{3}x = 3$
Multiply both sides by $\dfrac{3}{8}$,
$ \Rightarrow x = 3 \times \dfrac{3}{8}$
Multiply the terms on the right side,
$ \Rightarrow x = \dfrac{9}{8}$
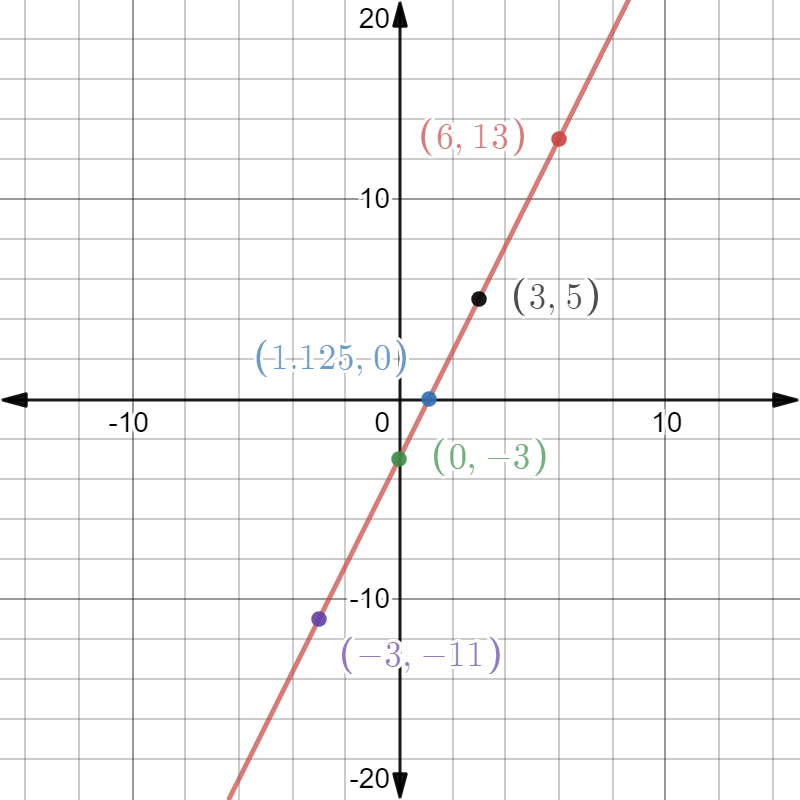
It means the curve cuts the x-axis at $\left( {\dfrac{9}{8},0} \right)$.
Let us put $x = 0$ and find the y-intercept. We have,
$ \Rightarrow y = \dfrac{8}{3} \times 0 - 3$
Simplify the terms,
$ \Rightarrow y = - 3$
It means the curve cuts the y-axis at $\left( {0, - 3} \right)$.
We have already two points for the equation $\left( {\dfrac{9}{8},0} \right)$ and $\left( {0, - 3} \right)$. We find y for three more points.
At $x = - 3$ we have,
$ \Rightarrow y = \dfrac{8}{3} \times - 3 - 3$
Cancel out the common terms,
$ \Rightarrow y = - 8 - 3$
Simplify the terms,
$ \Rightarrow y = - 11$
At $x = 6$ we have,
$ \Rightarrow y = \dfrac{8}{3} \times 6 - 3$
Cancel out the common terms,
$ \Rightarrow y = 16 - 3$
Simplify the terms,
$ \Rightarrow y = 13$
At $x = 3$ we have,
$ \Rightarrow y = \dfrac{8}{3} \times 3 - 3$
Cancel out the common terms,
$ \Rightarrow y = 8 - 3$
Simplify the terms,
$ \Rightarrow y = 5$
So, we draw the table for x and y.
We plot the above points and join them to have the graph as
Note: For this type of problem in which a graph of linear equations is required to draw. If the graph of the equation is not coming to a straight line then we can say that the points taken are wrong as the graph of the linear equation is always a straight line. So, if the graph through given points is a straight line and passing through them then it will be a correct sketch for the given linear equation.
Complete step by step solution:
We know that the graph of a function is the locus of points $\left( {x,y} \right)$ such that $y = f\left( x \right)$ where x, y are real numbers. We are given the following quadratic polynomial function,
$ \Rightarrow y = \dfrac{8}{3}x - 3$
So, let us put $y = 0$ and find the x-intercept. We have,
$ \Rightarrow 0 = \dfrac{8}{3}x - 3$
Move constant term on the other side,
$ \Rightarrow \dfrac{8}{3}x = 3$
Multiply both sides by $\dfrac{3}{8}$,
$ \Rightarrow x = 3 \times \dfrac{3}{8}$
Multiply the terms on the right side,
$ \Rightarrow x = \dfrac{9}{8}$
It means the curve cuts the x-axis at $\left( {\dfrac{9}{8},0} \right)$.
Let us put $x = 0$ and find the y-intercept. We have,
$ \Rightarrow y = \dfrac{8}{3} \times 0 - 3$
Simplify the terms,
$ \Rightarrow y = - 3$
It means the curve cuts the y-axis at $\left( {0, - 3} \right)$.
We have already two points for the equation $\left( {\dfrac{9}{8},0} \right)$ and $\left( {0, - 3} \right)$. We find y for three more points.
At $x = - 3$ we have,
$ \Rightarrow y = \dfrac{8}{3} \times - 3 - 3$
Cancel out the common terms,
$ \Rightarrow y = - 8 - 3$
Simplify the terms,
$ \Rightarrow y = - 11$
At $x = 6$ we have,
$ \Rightarrow y = \dfrac{8}{3} \times 6 - 3$
Cancel out the common terms,
$ \Rightarrow y = 16 - 3$
Simplify the terms,
$ \Rightarrow y = 13$
At $x = 3$ we have,
$ \Rightarrow y = \dfrac{8}{3} \times 3 - 3$
Cancel out the common terms,
$ \Rightarrow y = 8 - 3$
Simplify the terms,
$ \Rightarrow y = 5$
So, we draw the table for x and y.
| $X$ | $0$ | $ - \dfrac{9}{8}$ | $-3$ | $6$ | $3$ |
| $Y$ | $-3$ | $0$ | $-11$ | $13$ | $5$ |
We plot the above points and join them to have the graph as
Note: For this type of problem in which a graph of linear equations is required to draw. If the graph of the equation is not coming to a straight line then we can say that the points taken are wrong as the graph of the linear equation is always a straight line. So, if the graph through given points is a straight line and passing through them then it will be a correct sketch for the given linear equation.

Recently Updated Pages
Basicity of sulphurous acid and sulphuric acid are
Master Class 11 Business Studies: Engaging Questions & Answers for Success
Master Class 11 Computer Science: Engaging Questions & Answers for Success
Master Class 11 Economics: Engaging Questions & Answers for Success
Master Class 12 English: Engaging Questions & Answers for Success
Master Class 12 Social Science: Engaging Questions & Answers for Success
Trending doubts
Name the states through which the Tropic of Cancer class 8 social science CBSE
What are the 12 elements of nature class 8 chemistry CBSE
In Indian rupees 1 trillion is equal to how many c class 8 maths CBSE
Who created the image of Bharat Mata for the first class 8 social science CBSE
What is the Balkan issue in brief class 8 social science CBSE
Describe the elements of Belgian model for accommodating class 8 social science CBSE