


How do you graph $ y = \dfrac{4}{3}x + 2 $ ?
Answer
545.7k+ views
Hint: A graph shows the relation between two variable quantities, it contains two axes perpendicular to each other namely the x-axis and the y-axis. Each variable is measured along one of the axes. In the question, we are given one linear equation containing two variables namely x and y, x is measured along the x-axis and y is measured along the y-axis while tracing the given equations. To find the equation of a line, we must know the coordinates of at least two of the points lying on the line. We are given the equation of a line in the question so we have to find the coordinates using the given equation and then plot its graph.
Complete step-by-step answer:
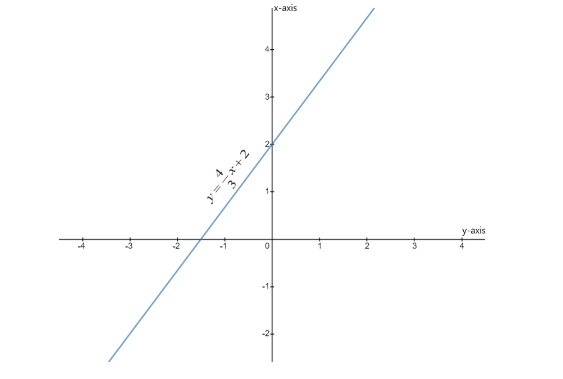
The equation of the line is \[y = \dfrac{4}{3}x + 2\]
When $ x = 0 $
\[
y = \dfrac{4}{3}(0) + 2 \\
\Rightarrow y = 2 \;
\]
The line cuts the y-axis at $ (0,2) $ .
When $ y = 0 $
\[
0 = \dfrac{4}{3}x + 2 \\
\Rightarrow x = - \dfrac{3}{2} \;
\]
The line cuts the x-axis at the point $ ( - \dfrac{3}{2},0) $ .
We can trace the line of the equation \[y = \dfrac{4}{3}x + 2\] by joining these two points and then extending the obtained line away in the opposite directions.
Note: We are given a linear equation in terms of two variable quantities namely x and y and we have to graph it. On putting random values of x, we can get random values of y and thus find the coordinates of one of the points lying on the line. To plot the graph of a straight line we must know the coordinates of at least two points lying on the line so we can put any random values of x and y. We put the value of both x and y zero one by one and then find the value of other variables from the equation of the line.
Complete step-by-step answer:
The equation of the line is \[y = \dfrac{4}{3}x + 2\]
When $ x = 0 $
\[
y = \dfrac{4}{3}(0) + 2 \\
\Rightarrow y = 2 \;
\]
The line cuts the y-axis at $ (0,2) $ .
When $ y = 0 $
\[
0 = \dfrac{4}{3}x + 2 \\
\Rightarrow x = - \dfrac{3}{2} \;
\]
The line cuts the x-axis at the point $ ( - \dfrac{3}{2},0) $ .
We can trace the line of the equation \[y = \dfrac{4}{3}x + 2\] by joining these two points and then extending the obtained line away in the opposite directions.
Note: We are given a linear equation in terms of two variable quantities namely x and y and we have to graph it. On putting random values of x, we can get random values of y and thus find the coordinates of one of the points lying on the line. To plot the graph of a straight line we must know the coordinates of at least two points lying on the line so we can put any random values of x and y. We put the value of both x and y zero one by one and then find the value of other variables from the equation of the line.

Recently Updated Pages
Master Class 8 Social Science: Engaging Questions & Answers for Success
Master Class 8 English: Engaging Questions & Answers for Success
Class 8 Question and Answer - Your Ultimate Solutions Guide
Master Class 8 Maths: Engaging Questions & Answers for Success
Master Class 8 Science: Engaging Questions & Answers for Success
Master Class 9 General Knowledge: Engaging Questions & Answers for Success
Trending doubts
What is BLO What is the full form of BLO class 8 social science CBSE
Citizens of India can vote at the age of A 18 years class 8 social science CBSE
Full form of STD, ISD and PCO
Advantages and disadvantages of science
Right to vote is a AFundamental Right BFundamental class 8 social science CBSE
What are the 12 elements of nature class 8 chemistry CBSE