


How do you graph \[y = - \dfrac{2}{3}x\] ?
Answer
540.6k+ views
Hint: To solve this we need to give the values of ‘x’ and we can find the values of ‘y’. Otherwise we can find the coordinate of the given equation lying on the line of x- axis, we can find this by substituting the value of ‘y’ is equal to zero (x-intercept). Similarly we can find the coordinate of the equation lying on the line of y- axis, we can find this by substituting the value of ‘x’ equal to zero (y-intercept).
Complete step-by-step answer:
Given, \[y = - \dfrac{2}{3}x\] .
Here we can’t use the intercept concept to draw the graph, because in this case if we give value of ‘x’ is equal to zero we will get ‘y’ value as zero and vice versa. Hence the given equation passes through origin. So we give random values of ‘x’ then we get the value of ‘y’. That is we have ordered pairs (x, y) (co-ordinates).
We will give the values of ‘x’ randomly.
Put \[x = 1\] in \[y = - \dfrac{2}{3}x\] .
\[y = - \dfrac{2}{3}\]
\[y = - 0.666\]
Rounding off we have,
\[y = - 0.67\]
Thus we have a coordinate \[y = (1, - 0.67)\] . We have a decimal number it will be difficult to point out the points in the graph.
If we give \[x = 2\] we will again get a decimal number.
Now put \[x = 3\] in \[y = - \dfrac{2}{3}x\] .
\[y = - \dfrac{2}{3} \times 3\]
\[y = - 2\] .
Thus we have the coordinate \[(3, - 2)\] .
Similarly if we put \[x = - 3\] in \[y = - \dfrac{2}{3}x\] ,
\[y = - \dfrac{2}{3} \times - 3\]
\[y = 2\] .
Thus we have the coordinate \[( - 3,2)\] .
Similarly if we put \[x = \pm 4, \pm 5\] we will have a decimal number.
Lets put \[x = 6\] in \[y = - \dfrac{2}{3}x\]
\[y = - \dfrac{2}{3} \times 6\]
\[y = - 4\]
Thus we have coordinates \[(6, - 4)\] .
Lets put \[x = - 6\] in \[y = - \dfrac{2}{3}x\]
\[y = - \dfrac{2}{3} \times - 6\]
\[y = 4\]
Thus we have coordinate \[( - 6,4)\] .
Hence we have the coordinates
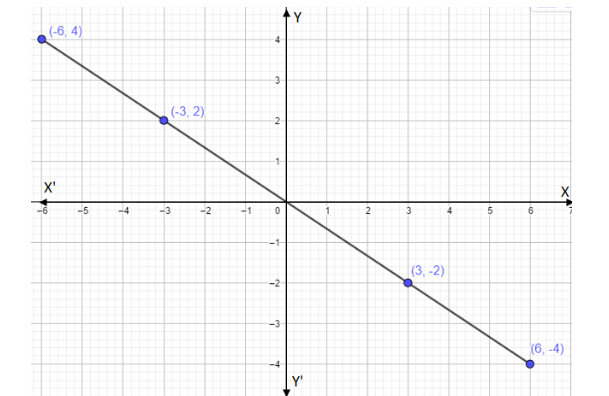
Let’s plot a graph for this coordinates \[(3, - 2)\] , \[( - 3,2)\] , \[(6, - 4)\] and \[( - 6,4)\]
We take scale x-axis= 1 unit = 1 units
y-axis= 1 unit = 1 units
Note: We can use decimal numbers as a coordinate but it will be difficult to point out as compared with natural numbers. A graph shows the relation between two variable quantities, it contains two axes perpendicular to each other namely the x-axis and the y-axis. Each variable is measured along one of the axes. In the question, we are given one linear equation containing two variables namely x and y, x is measured along the x-axis and y is measured along the y-axis while tracing the given equations.
Complete step-by-step answer:
Given, \[y = - \dfrac{2}{3}x\] .
Here we can’t use the intercept concept to draw the graph, because in this case if we give value of ‘x’ is equal to zero we will get ‘y’ value as zero and vice versa. Hence the given equation passes through origin. So we give random values of ‘x’ then we get the value of ‘y’. That is we have ordered pairs (x, y) (co-ordinates).
We will give the values of ‘x’ randomly.
Put \[x = 1\] in \[y = - \dfrac{2}{3}x\] .
\[y = - \dfrac{2}{3}\]
\[y = - 0.666\]
Rounding off we have,
\[y = - 0.67\]
Thus we have a coordinate \[y = (1, - 0.67)\] . We have a decimal number it will be difficult to point out the points in the graph.
If we give \[x = 2\] we will again get a decimal number.
Now put \[x = 3\] in \[y = - \dfrac{2}{3}x\] .
\[y = - \dfrac{2}{3} \times 3\]
\[y = - 2\] .
Thus we have the coordinate \[(3, - 2)\] .
Similarly if we put \[x = - 3\] in \[y = - \dfrac{2}{3}x\] ,
\[y = - \dfrac{2}{3} \times - 3\]
\[y = 2\] .
Thus we have the coordinate \[( - 3,2)\] .
Similarly if we put \[x = \pm 4, \pm 5\] we will have a decimal number.
Lets put \[x = 6\] in \[y = - \dfrac{2}{3}x\]
\[y = - \dfrac{2}{3} \times 6\]
\[y = - 4\]
Thus we have coordinates \[(6, - 4)\] .
Lets put \[x = - 6\] in \[y = - \dfrac{2}{3}x\]
\[y = - \dfrac{2}{3} \times - 6\]
\[y = 4\]
Thus we have coordinate \[( - 6,4)\] .
Hence we have the coordinates
Let’s plot a graph for this coordinates \[(3, - 2)\] , \[( - 3,2)\] , \[(6, - 4)\] and \[( - 6,4)\]
We take scale x-axis= 1 unit = 1 units
y-axis= 1 unit = 1 units
Note: We can use decimal numbers as a coordinate but it will be difficult to point out as compared with natural numbers. A graph shows the relation between two variable quantities, it contains two axes perpendicular to each other namely the x-axis and the y-axis. Each variable is measured along one of the axes. In the question, we are given one linear equation containing two variables namely x and y, x is measured along the x-axis and y is measured along the y-axis while tracing the given equations.
Recently Updated Pages
Master Class 11 English: Engaging Questions & Answers for Success
Master Class 11 Maths: Engaging Questions & Answers for Success
Master Class 11 Biology: Engaging Questions & Answers for Success
Master Class 11 Social Science: Engaging Questions & Answers for Success
Master Class 11 Physics: Engaging Questions & Answers for Success
Master Class 11 Accountancy: Engaging Questions & Answers for Success
Trending doubts
What is BLO What is the full form of BLO class 8 social science CBSE
Citizens of India can vote at the age of A 18 years class 8 social science CBSE
Full form of STD, ISD and PCO
Convert 40circ C to Fahrenheit A 104circ F B 107circ class 8 maths CBSE
Advantages and disadvantages of science
Right to vote is a AFundamental Right BFundamental class 8 social science CBSE