


How do you graph \[y = \dfrac{1}{{{x^2}}}\]?
Answer
558.6k+ views
Hint: In the given question, we have been given an equation. It is an equation in two variables. On the left-hand side of the equality is the ‘y’ which is equal to ‘x squared’ on the right-hand side. We have to graph this expression. To do that, we take two points of ‘x’ and calculate the corresponding two points of ‘y’, plot them on the graph, join the points, extend the line and get our required graph.
Complete step by step answer:
The given equation is
\[y = \dfrac{1}{{{x^2}}}\]
We are going to have to take two points:
First point:
\[x = \dfrac{1}{2}\]
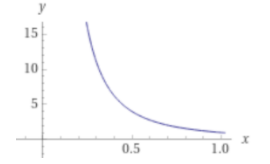
For \[x = \dfrac{1}{2}\], the value of \[y = \dfrac{1}{{\dfrac{1}{4}}} = 4\]
Hence, one ordered pair is \[\left( {\dfrac{1}{2},4} \right)\]
Second point:
\[x = 1\]
For \[x = 1\], the value of \[y = 1\]
Hence, the second ordered pair is \[\left( {1,1} \right)\].
Now, we plot the points and get the graph:
Note: In the given question, we had to graph a reciprocal square function. To do that, we first took a value of ‘x’ and calculated the corresponding value of ‘y’. Then we repeated the step again. Then we got two ordered pairs. Then we plotted them on the graph, joined the points, extended the line and we got our required graph.
Complete step by step answer:
The given equation is
\[y = \dfrac{1}{{{x^2}}}\]
We are going to have to take two points:
First point:
\[x = \dfrac{1}{2}\]
For \[x = \dfrac{1}{2}\], the value of \[y = \dfrac{1}{{\dfrac{1}{4}}} = 4\]
Hence, one ordered pair is \[\left( {\dfrac{1}{2},4} \right)\]
Second point:
\[x = 1\]
For \[x = 1\], the value of \[y = 1\]
Hence, the second ordered pair is \[\left( {1,1} \right)\].
Now, we plot the points and get the graph:
Note: In the given question, we had to graph a reciprocal square function. To do that, we first took a value of ‘x’ and calculated the corresponding value of ‘y’. Then we repeated the step again. Then we got two ordered pairs. Then we plotted them on the graph, joined the points, extended the line and we got our required graph.
Recently Updated Pages
Master Class 10 Computer Science: Engaging Questions & Answers for Success
Master Class 10 General Knowledge: Engaging Questions & Answers for Success
Master Class 10 English: Engaging Questions & Answers for Success
Master Class 10 Social Science: Engaging Questions & Answers for Success
Master Class 10 Maths: Engaging Questions & Answers for Success
Master Class 10 Science: Engaging Questions & Answers for Success
Trending doubts
What is the median of the first 10 natural numbers class 10 maths CBSE
Which women's tennis player has 24 Grand Slam singles titles?
Who is the Brand Ambassador of Incredible India?
Why is there a time difference of about 5 hours between class 10 social science CBSE
Write a letter to the principal requesting him to grant class 10 english CBSE
A moving boat is observed from the top of a 150 m high class 10 maths CBSE