


How do you graph \[y = \dfrac{1}{3}x + 5\]?
Answer
556.5k+ views
Hint: Here in this question, we have to plot the graph, where the equation for the graph is given in the question. Substituting the known values to the equation we can find the value of unknown of the equation. Hence, we can plot the graph by using the values.
Complete step-by-step answer:
The equation of a graph is given as \[y = \dfrac{1}{3}x + 5\] . we will substitute the value of x as randomly and we are going to find the value of y. the coefficient of x is in the form of fraction, the denominator value is 3. Let the values of x be -9, -6, -3, 0, 3, 6, 9
Now we consider the value of x and we substitute in the equation of graph\[y = \dfrac{1}{3}x + 5\], hence we can find the value of y
Consider the equation of graph \[y = \dfrac{1}{3}x + 5\]------ (1)
Substitute the value of x as -9 in equation (1). So we have
\[
\Rightarrow y = \dfrac{1}{3}( - 9) + 5 \\
\Rightarrow y = - 3 + 5 \\
\Rightarrow y = 2 \\
\]
When x is -9 the value of y is 2
Substitute the value of x as -6 in equation (1). So we have
\[
\Rightarrow y = \dfrac{1}{3}( - 6) + 5 \\
\Rightarrow y = - 2 + 5 \\
\Rightarrow y = 3 \\
\]
When x is -6 the value of y is 3
Substitute the value of x as -3 in equation (1). So we have
\[
\Rightarrow y = \dfrac{1}{3}( - 3) + 5 \\
\Rightarrow y = - 1 + 5 \\
\Rightarrow y = 4 \\
\]
When x is -3 the value of y is 4
Substitute the value of x as 0 in equation (1). So we have
\[
\Rightarrow y = \dfrac{1}{3}(0) + 5 \\
\Rightarrow y = 0 + 5 \\
\Rightarrow y = 5 \\
\]
When x is 0 the value of y is 5
Substitute the value of x as 3 in equation (1). So we have
\[
\Rightarrow y = \dfrac{1}{3}(3) + 5 \\
\Rightarrow y = 1 + 5 \\
\Rightarrow y = 6 \\
\]
When x is 3 the value of y is 6
Substitute the value of x as 6 in equation (1). So we have
\[
\Rightarrow y = \dfrac{1}{3}(6) + 5 \\
\Rightarrow y = 2 + 5 \\
\Rightarrow y = 7 \\
\]
When x is 6 the value of y is 7
Substitute the value of x as 9 in equation (1). So we have
\[
\Rightarrow y = \dfrac{1}{3}(9) + 5 \\
\Rightarrow y = 3 + 5 \\
\Rightarrow y = 8 \\
\]
When x is 9 the value of y is 8
Therefore, we have table as
Considering these points we can plot the graph. The graph is shown below.
Note: The question is belonging to the concept of graph. By comparing the given equation to the equation of a line we calculate the slope and intercept. Or by choosing the value of x we can determine the value of y and then plotting the graphs for these points we obtain the result.
Complete step-by-step answer:
The equation of a graph is given as \[y = \dfrac{1}{3}x + 5\] . we will substitute the value of x as randomly and we are going to find the value of y. the coefficient of x is in the form of fraction, the denominator value is 3. Let the values of x be -9, -6, -3, 0, 3, 6, 9
Now we consider the value of x and we substitute in the equation of graph\[y = \dfrac{1}{3}x + 5\], hence we can find the value of y
Consider the equation of graph \[y = \dfrac{1}{3}x + 5\]------ (1)
Substitute the value of x as -9 in equation (1). So we have
\[
\Rightarrow y = \dfrac{1}{3}( - 9) + 5 \\
\Rightarrow y = - 3 + 5 \\
\Rightarrow y = 2 \\
\]
When x is -9 the value of y is 2
Substitute the value of x as -6 in equation (1). So we have
\[
\Rightarrow y = \dfrac{1}{3}( - 6) + 5 \\
\Rightarrow y = - 2 + 5 \\
\Rightarrow y = 3 \\
\]
When x is -6 the value of y is 3
Substitute the value of x as -3 in equation (1). So we have
\[
\Rightarrow y = \dfrac{1}{3}( - 3) + 5 \\
\Rightarrow y = - 1 + 5 \\
\Rightarrow y = 4 \\
\]
When x is -3 the value of y is 4
Substitute the value of x as 0 in equation (1). So we have
\[
\Rightarrow y = \dfrac{1}{3}(0) + 5 \\
\Rightarrow y = 0 + 5 \\
\Rightarrow y = 5 \\
\]
When x is 0 the value of y is 5
Substitute the value of x as 3 in equation (1). So we have
\[
\Rightarrow y = \dfrac{1}{3}(3) + 5 \\
\Rightarrow y = 1 + 5 \\
\Rightarrow y = 6 \\
\]
When x is 3 the value of y is 6
Substitute the value of x as 6 in equation (1). So we have
\[
\Rightarrow y = \dfrac{1}{3}(6) + 5 \\
\Rightarrow y = 2 + 5 \\
\Rightarrow y = 7 \\
\]
When x is 6 the value of y is 7
Substitute the value of x as 9 in equation (1). So we have
\[
\Rightarrow y = \dfrac{1}{3}(9) + 5 \\
\Rightarrow y = 3 + 5 \\
\Rightarrow y = 8 \\
\]
When x is 9 the value of y is 8
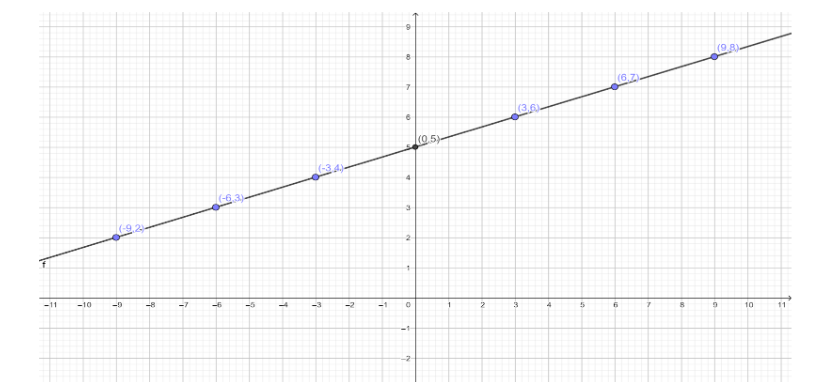
Therefore, we have table as
| x | -9 | -6 | -3 | 0 | 3 | 6 | 9 |
| y | 2 | 3 | 4 | 5 | 6 | 7 | 8 |
Considering these points we can plot the graph. The graph is shown below.
Note: The question is belonging to the concept of graph. By comparing the given equation to the equation of a line we calculate the slope and intercept. Or by choosing the value of x we can determine the value of y and then plotting the graphs for these points we obtain the result.

Recently Updated Pages
While covering a distance of 30km Ajeet takes 2 ho-class-11-maths-CBSE
Master Class 12 English: Engaging Questions & Answers for Success
Master Class 12 Social Science: Engaging Questions & Answers for Success
Master Class 12 Maths: Engaging Questions & Answers for Success
Master Class 12 Economics: Engaging Questions & Answers for Success
Master Class 12 Physics: Engaging Questions & Answers for Success
Trending doubts
Difference Between Plant Cell and Animal Cell
Fill the blanks with the suitable prepositions 1 The class 9 english CBSE
Which places in India experience sunrise first and class 9 social science CBSE
Name 10 Living and Non living things class 9 biology CBSE
What is the full form of pH?
Write the 6 fundamental rights of India and explain in detail