


How do you graph \[y = \dfrac{1}{2}{x^2}?\]
Answer
605.7k+ views
Hint:The given question describes the operation of using arithmetic operations like addition/ subtraction/ multiplication/ division. Also, this problem involves substituting the \[x\] in the given equation to find the value of \[y\]. Because \[y\] is the function of \[x\] . By using the values of \[x\]and\[y\] we can easily draw the graph for the given equation.
Complete step by step solution:
The given equation is shown below,
\[y = \dfrac{1}{2}{x^2}\]
We would draw the graph for the above equation.
As a first step,
We would assume \[x\] value as given below,
\[x = ..... - 2, - 1,0,1,2,....\]
By substituting the above-mentioned \[x\] values in the given equation we can find the \[y\] values.
The given equation is,
\[y = \dfrac{1}{2}{x^2}\]\[ \to \left( 1 \right)\]
Let’s substitute \[x = - 2\] in the equation\[\left( 1 \right)\]we get,
\[y = \dfrac{1}{2}{x^2}\]
\[y = \dfrac{1}{2}{\left( { - 2} \right)^2}\]
\[
y = \dfrac{1}{2} \times 4 \\
y = 2 \\
\]
So, we get
When \[x = - 2\] the value of\[y\]is\[2\].
Let’s substitute\[x = - 1\] in the equation\[\left( 1 \right)\]we get,
\[y = \dfrac{1}{2}{x^2}\]
\[y = \dfrac{1}{2}{\left( { - 1} \right)^2}\]
\[
y = \dfrac{1}{2} \times 1 \\
y = \dfrac{1}{2} \\
\]
So we get,
When \[x = - 1\] the value of\[y\]is\[\dfrac{1}{2}\].
Let’s substitute \[x = 0\] in the equation \[\left( 1 \right)\], we get
\[y = \dfrac{1}{2}{x^2}\]
\[y = \dfrac{1}{2}{\left( 0 \right)^2}\]
\[y = 0\]
So we get,
When \[x = 0\] the value \[y\] is equal to\[0\].
Let’s substitute \[x = 1\] in the equation \[\left( 1 \right)\], we get
\[y = \dfrac{1}{2}{x^2}\]
\[y = \dfrac{1}{2}{\left( 1 \right)^2}\]
\[y = \dfrac{1}{2}\]
So we get,
When \[x = 1\] the value \[y\]is equal to \[\dfrac{1}{2}\].
Let’s substitute \[x = 2\] in the equation \[\left( 1 \right)\] we get,
\[y = \dfrac{1}{2}{x^2}\]
\[y = \dfrac{1}{2}{\left( 2 \right)^2}\]
\[
y = \dfrac{1}{2} \times 4 \\
y = 2 \\
\]
So we get,
When \[x = 2\] the value of\[y\]is\[2\].
Let’s make a tabular column by using the values of \[x\] and \[y\].
By using this table we can easily draw the graph for the given equation.
The above graph represents the equation \[y = \dfrac{1}{2}{x^2}\].
Note: This question describes the operation of addition/ subtraction/ multiplication/ division. Note that when the given equation is in the form of \[y = a{x^2}\] then the graph must be in parabolic shape.
Also, note that anything power zero will be one, and zero power anything will be one. When multiplying two different sign terms remember the following things,
1) \[\left( - \right) \times \left( - \right) = \left( + \right)\]
2) \[\left( + \right) \times \left( + \right) = \left( + \right)\]
3) \[\left( - \right) \times \left( + \right) = \left( - \right)\]
Complete step by step solution:
The given equation is shown below,
\[y = \dfrac{1}{2}{x^2}\]
We would draw the graph for the above equation.
As a first step,
We would assume \[x\] value as given below,
\[x = ..... - 2, - 1,0,1,2,....\]
By substituting the above-mentioned \[x\] values in the given equation we can find the \[y\] values.
The given equation is,
\[y = \dfrac{1}{2}{x^2}\]\[ \to \left( 1 \right)\]
Let’s substitute \[x = - 2\] in the equation\[\left( 1 \right)\]we get,
\[y = \dfrac{1}{2}{x^2}\]
\[y = \dfrac{1}{2}{\left( { - 2} \right)^2}\]
\[
y = \dfrac{1}{2} \times 4 \\
y = 2 \\
\]
So, we get
When \[x = - 2\] the value of\[y\]is\[2\].
Let’s substitute\[x = - 1\] in the equation\[\left( 1 \right)\]we get,
\[y = \dfrac{1}{2}{x^2}\]
\[y = \dfrac{1}{2}{\left( { - 1} \right)^2}\]
\[
y = \dfrac{1}{2} \times 1 \\
y = \dfrac{1}{2} \\
\]
So we get,
When \[x = - 1\] the value of\[y\]is\[\dfrac{1}{2}\].
Let’s substitute \[x = 0\] in the equation \[\left( 1 \right)\], we get
\[y = \dfrac{1}{2}{x^2}\]
\[y = \dfrac{1}{2}{\left( 0 \right)^2}\]
\[y = 0\]
So we get,
When \[x = 0\] the value \[y\] is equal to\[0\].
Let’s substitute \[x = 1\] in the equation \[\left( 1 \right)\], we get
\[y = \dfrac{1}{2}{x^2}\]
\[y = \dfrac{1}{2}{\left( 1 \right)^2}\]
\[y = \dfrac{1}{2}\]
So we get,
When \[x = 1\] the value \[y\]is equal to \[\dfrac{1}{2}\].
Let’s substitute \[x = 2\] in the equation \[\left( 1 \right)\] we get,
\[y = \dfrac{1}{2}{x^2}\]
\[y = \dfrac{1}{2}{\left( 2 \right)^2}\]
\[
y = \dfrac{1}{2} \times 4 \\
y = 2 \\
\]
So we get,
When \[x = 2\] the value of\[y\]is\[2\].
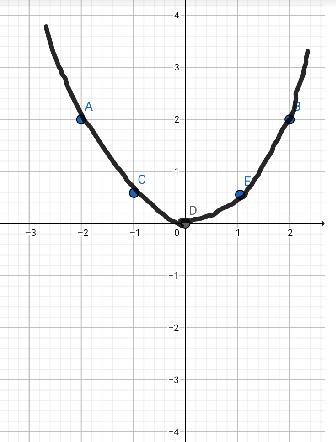
| \[x\] | \[ - 2\] | \[ - 1\] | \[0\] | \[1\] | \[2\] |
| \[y\] | \[2\] | \[\dfrac{1}{2}\] | \[0\] | \[\dfrac{1}{2}\] | \[2\] |
Let’s make a tabular column by using the values of \[x\] and \[y\].
By using this table we can easily draw the graph for the given equation.
The above graph represents the equation \[y = \dfrac{1}{2}{x^2}\].
Note: This question describes the operation of addition/ subtraction/ multiplication/ division. Note that when the given equation is in the form of \[y = a{x^2}\] then the graph must be in parabolic shape.
Also, note that anything power zero will be one, and zero power anything will be one. When multiplying two different sign terms remember the following things,
1) \[\left( - \right) \times \left( - \right) = \left( + \right)\]
2) \[\left( + \right) \times \left( + \right) = \left( + \right)\]
3) \[\left( - \right) \times \left( + \right) = \left( - \right)\]
Recently Updated Pages
Basicity of sulphurous acid and sulphuric acid are
Master Class 12 Economics: Engaging Questions & Answers for Success
Master Class 12 Biology: Engaging Questions & Answers for Success
Master Class 11 English: Engaging Questions & Answers for Success
Master Class 11 Physics: Engaging Questions & Answers for Success
Master Class 11 Computer Science: Engaging Questions & Answers for Success
Trending doubts
Draw a diagram of a plant cell and label at least eight class 11 biology CBSE
Proton was discovered by A Thomson B Rutherford C Chadwick class 11 chemistry CBSE
What is the purity of pure gold in carat class 11 chemistry CBSE
Can anyone list 10 advantages and disadvantages of friction
Lysosomes are known as suicidal bags of cell why class 11 biology CBSE
Derive the equation of motion by the calculus method class 11 physics CBSE