


How do you graph $y = \dfrac{1}{{1 + {x^2}}}$ ?
Answer
554.1k+ views
Hint: In this question, we are given an equation containing two variable unknown quantities. To plot a given equation of graph, we must know the coordinates of at least two points that lie on the curve. To find those two points we put some random values of x and get the values of y from the equation. Plotting the two obtained points and extending the line, we get the required graph.
Complete step-by-step solution:
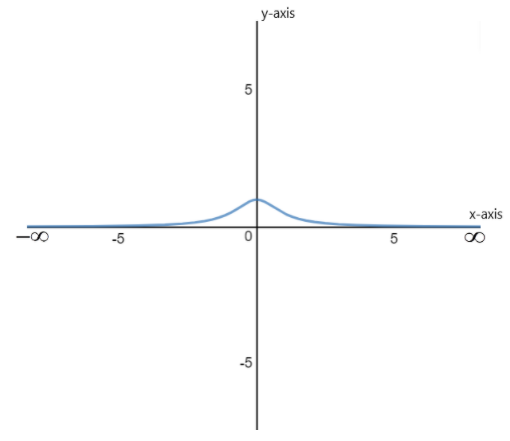
The given function is
\[y = \dfrac{1}{{1 + {x^2}}}\]
As the numerator is equal to 1 so it is positive and the denominator is the square of a number added to 1, so the denominator is also positive. Thus the value of y for any value of x comes out to be positive and x can take any real number as its value.
As the value of the denominator decreases, the value of y will increase, so the value of y is maximum when x=0.
As the value of x increases or decreases, the square of x will increase either way and thus the value of the $1 + {x^2}$ increases and value of $y = \dfrac{1}{{1 + {x^2}}}$ decreases.
Hence, the graph of the function $y = \dfrac{1}{{1 + {x^2}}}$is given as –
Note: We see that in this equation the left side contains only ”y” and the right side contains the ratio of 1 and $1 + {x^2}$ , that is, in this equation y is expressed in terms of x, thus the given equation is a function in terms of x. As the value of x changes the value of y also changes. So, x is called the independent variable and y is called the dependent variable.
Complete step-by-step solution:
The given function is
\[y = \dfrac{1}{{1 + {x^2}}}\]
As the numerator is equal to 1 so it is positive and the denominator is the square of a number added to 1, so the denominator is also positive. Thus the value of y for any value of x comes out to be positive and x can take any real number as its value.
As the value of the denominator decreases, the value of y will increase, so the value of y is maximum when x=0.
As the value of x increases or decreases, the square of x will increase either way and thus the value of the $1 + {x^2}$ increases and value of $y = \dfrac{1}{{1 + {x^2}}}$ decreases.
Hence, the graph of the function $y = \dfrac{1}{{1 + {x^2}}}$is given as –
Note: We see that in this equation the left side contains only ”y” and the right side contains the ratio of 1 and $1 + {x^2}$ , that is, in this equation y is expressed in terms of x, thus the given equation is a function in terms of x. As the value of x changes the value of y also changes. So, x is called the independent variable and y is called the dependent variable.
Recently Updated Pages
Master Class 11 Computer Science: Engaging Questions & Answers for Success
Master Class 11 Business Studies: Engaging Questions & Answers for Success
Master Class 11 Economics: Engaging Questions & Answers for Success
Master Class 11 English: Engaging Questions & Answers for Success
Master Class 11 Maths: Engaging Questions & Answers for Success
Master Class 11 Biology: Engaging Questions & Answers for Success
Trending doubts
One Metric ton is equal to kg A 10000 B 1000 C 100 class 11 physics CBSE
There are 720 permutations of the digits 1 2 3 4 5 class 11 maths CBSE
Discuss the various forms of bacteria class 11 biology CBSE
Draw a diagram of a plant cell and label at least eight class 11 biology CBSE
State the laws of reflection of light
Explain zero factorial class 11 maths CBSE