


How do you graph $y = \cot x + 2$?
Answer
569.7k+ views
Hint: This problem deals with plotting the given equation which is in a trigonometric form of function. Here the graph of the given equation is plotted by taking one step at a time that is, by considering the value of the variable $x$ to be varying and hence finding the corresponding values of $y$ to plot the desired resulting graph.
Complete step by step solution:
Given that a function which varies with the variable $x$, is actually an equation in terms of trigonometric function.
The given equation is $y = \cot x + 2$.
Now consider the given equation as shown below:
$ \Rightarrow y = \cot x + 2$
Now plotting the given equation in a graph by considering the value of $x$ and $y$, as shown below:
For the value of $x = 0$, the value of $y$ is given by substituting the value of $x$ in the given equation.
$ \Rightarrow y = \cot \left( 0 \right) + 2$
We know that $\cot x = \infty$ when $x = 0$, so when $x$ approaches zero, $\cot x$ approaches infinity.
At $x = 0$, $y = \infty $.
For the value of $x = \dfrac{\pi }{4}$, the value of $y$ is given by substituting the value of $x$ in the given equation.
$ \Rightarrow y = \cot \left( {\dfrac{\pi }{4}} \right) + 2$
We know that $\cot \left( {\dfrac{\pi }{4}} \right) = 1$ when $x = \dfrac{\pi }{4}$.
$ \Rightarrow y = 1 + 2$
At$x = \dfrac{\pi }{4}$, $y = 3$
For the value of $x = \pi $, the value of $y$ is given by substituting the value of $x$ in the given equation.
$ \Rightarrow y = \cot \left( \pi \right) + 2$
We know that $\cot x = \infty $ when $x = \pi$, so when $x$ approaches $\pi$, $\cot x$ approaches infinity.
At $x = \pi$, $y = \infty $.
And hence this keeps on repeating for every cycle. Now with this help we can plot the graph of the given equation which is $y = \cot x + 2$, as shown below:
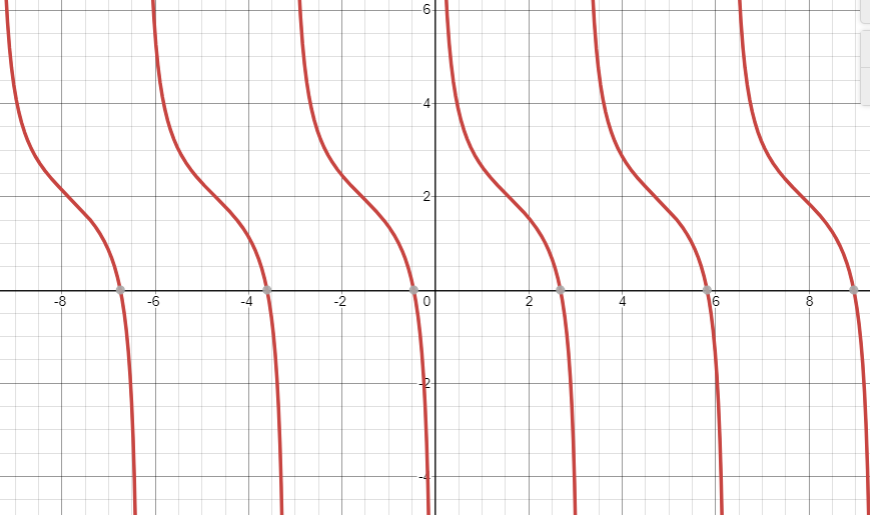
Note: Please note that the above problem is solved by plotting the given equation which is given by $y = \cot x + 2$, here this can also be done by considering the value of the function $\cot x$ to be $f(x)$.
So here first we can plot $y = f(x)$ and then add 2, still getting the same plot.
Complete step by step solution:
Given that a function which varies with the variable $x$, is actually an equation in terms of trigonometric function.
The given equation is $y = \cot x + 2$.
Now consider the given equation as shown below:
$ \Rightarrow y = \cot x + 2$
Now plotting the given equation in a graph by considering the value of $x$ and $y$, as shown below:
For the value of $x = 0$, the value of $y$ is given by substituting the value of $x$ in the given equation.
$ \Rightarrow y = \cot \left( 0 \right) + 2$
We know that $\cot x = \infty$ when $x = 0$, so when $x$ approaches zero, $\cot x$ approaches infinity.
At $x = 0$, $y = \infty $.
For the value of $x = \dfrac{\pi }{4}$, the value of $y$ is given by substituting the value of $x$ in the given equation.
$ \Rightarrow y = \cot \left( {\dfrac{\pi }{4}} \right) + 2$
We know that $\cot \left( {\dfrac{\pi }{4}} \right) = 1$ when $x = \dfrac{\pi }{4}$.
$ \Rightarrow y = 1 + 2$
At$x = \dfrac{\pi }{4}$, $y = 3$
For the value of $x = \pi $, the value of $y$ is given by substituting the value of $x$ in the given equation.
$ \Rightarrow y = \cot \left( \pi \right) + 2$
We know that $\cot x = \infty $ when $x = \pi$, so when $x$ approaches $\pi$, $\cot x$ approaches infinity.
At $x = \pi$, $y = \infty $.
And hence this keeps on repeating for every cycle. Now with this help we can plot the graph of the given equation which is $y = \cot x + 2$, as shown below:
Note: Please note that the above problem is solved by plotting the given equation which is given by $y = \cot x + 2$, here this can also be done by considering the value of the function $\cot x$ to be $f(x)$.
So here first we can plot $y = f(x)$ and then add 2, still getting the same plot.
Recently Updated Pages
Master Class 11 Social Science: Engaging Questions & Answers for Success
Master Class 11 English: Engaging Questions & Answers for Success
Master Class 11 Maths: Engaging Questions & Answers for Success
Master Class 11 Chemistry: Engaging Questions & Answers for Success
Master Class 11 Biology: Engaging Questions & Answers for Success
Master Class 11 Physics: Engaging Questions & Answers for Success
Trending doubts
Differentiate between an exothermic and an endothermic class 11 chemistry CBSE
One Metric ton is equal to kg A 10000 B 1000 C 100 class 11 physics CBSE
Difference Between Prokaryotic Cells and Eukaryotic Cells
There are 720 permutations of the digits 1 2 3 4 5 class 11 maths CBSE
Draw a diagram of a plant cell and label at least eight class 11 biology CBSE
Which chemical is known as king of chemicals A H 2 class 11 chemistry CBSE