


How do you graph $y = 5{x^2}$?
Answer
545.7k+ views
Hint: A parabola is defined as a curve in which every point is at a fixed distance from a fixed point and a fixed straight line. The fixed point is called the focus and the fixed straight line is called the directrix. The equation of a parabola is of the form $y = k{x^2}$ , from this equation we observe that a parabola passes through the origin, is U-shaped and y is always positive. The given equation is the equation of a parabola. So, using the above knowledge we will plot the graph of the given parabola.
Complete step-by-step answer:
We have to graph $y = 5{x^2}$
We will put different values of x and obtain the corresponding values of y.We can find the two points by putting random values of one variable and finding out the value of the other variable from the given equation. To find the graph of a straight line, coordinates of two points lying on the straight line are enough but to find the graph of a curve, we need more coordinates to observe the pattern.
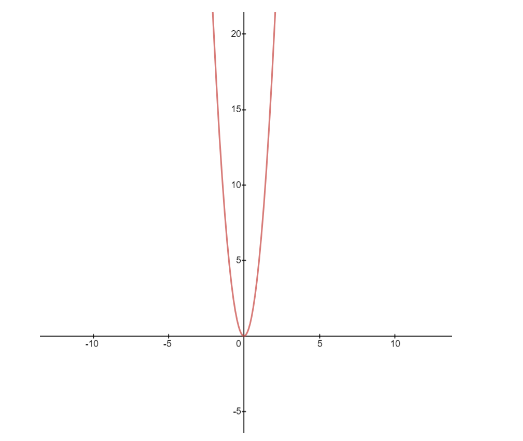
At $x = 0,\,y = 5{(0)^2} = 0$
At $x = 1,\,y = 5{(1)^2} = 5$
At $x = 2,\,y = 5{(2)^2} = 20$
At $x = - 1,\,y = 5{( - 1)^2} = 5$
At $x = - 2,\,y = 5{( - 2)^2} = 20$
Using these points, we can plot the graph of $y = 5{x^2}$ as –
Note: A graph shows the relation between two variable quantities, it contains two axes perpendicular to each other namely the x-axis and the y-axis. Each variable is measured along one of the axes. In the question, we are given one linear equation containing two variables namely x and y, x is measured along the x-axis and y is measured along the y-axis while tracing the given equations.
Complete step-by-step answer:
We have to graph $y = 5{x^2}$
We will put different values of x and obtain the corresponding values of y.We can find the two points by putting random values of one variable and finding out the value of the other variable from the given equation. To find the graph of a straight line, coordinates of two points lying on the straight line are enough but to find the graph of a curve, we need more coordinates to observe the pattern.
At $x = 0,\,y = 5{(0)^2} = 0$
At $x = 1,\,y = 5{(1)^2} = 5$
At $x = 2,\,y = 5{(2)^2} = 20$
At $x = - 1,\,y = 5{( - 1)^2} = 5$
At $x = - 2,\,y = 5{( - 2)^2} = 20$
Using these points, we can plot the graph of $y = 5{x^2}$ as –
Note: A graph shows the relation between two variable quantities, it contains two axes perpendicular to each other namely the x-axis and the y-axis. Each variable is measured along one of the axes. In the question, we are given one linear equation containing two variables namely x and y, x is measured along the x-axis and y is measured along the y-axis while tracing the given equations.

Recently Updated Pages
Master Class 11 Computer Science: Engaging Questions & Answers for Success
Master Class 11 Business Studies: Engaging Questions & Answers for Success
Master Class 11 Economics: Engaging Questions & Answers for Success
Master Class 11 English: Engaging Questions & Answers for Success
Master Class 11 Maths: Engaging Questions & Answers for Success
Master Class 11 Biology: Engaging Questions & Answers for Success
Trending doubts
What is BLO What is the full form of BLO class 8 social science CBSE
Citizens of India can vote at the age of A 18 years class 8 social science CBSE
Full form of STD, ISD and PCO
Convert 40circ C to Fahrenheit A 104circ F B 107circ class 8 maths CBSE
Advantages and disadvantages of science
Right to vote is a AFundamental Right BFundamental class 8 social science CBSE