


How do you graph y = 4x ?
Answer
595.8k+ views
Hint: In the given question, we have an equation in two variables. We have to plot the line on a graph which forms from this equation. Firstly convert the given equation to slope intercept form. From there, we find out the value of slope and the y- intercept. We plot a point at the y-intercept on y-axis. From there, we move up or down and then right or left depending upon the coefficient of x and y respectively, and join the points to form the line.
Complete step by step solution:
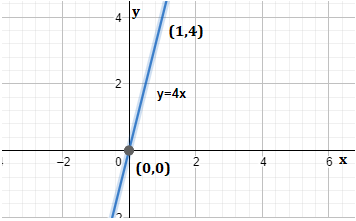
We have been given an equation y = 4x.
Clearly, this equation is of the type y = mx + c, hence, is already in the slope-intercept form.
Thus, slope m = 4 and, y-intercept c = 0
Hence, one point on the graph can be taken as (0,0).
Now,
$m=\dfrac{\text{coefficient of x }}{\text{coefficient of y } }$
Hence, we move up 1 (coefficient of y) points and then move to the right 4 (coefficient of x) points.
Thus, the second point is (0 + 1, 0 + 4) = (1, 4).
Now, we plot the two points and join them and we have our line.
Note: In this question, we only need to know how to get the points for the graph and then, how to plot the points on the graph. Then we just calculate the values from the equation, plot them on the graph, join the points on the graph and we get the line which marks the required equation.
Complete step by step solution:
We have been given an equation y = 4x.
Clearly, this equation is of the type y = mx + c, hence, is already in the slope-intercept form.
Thus, slope m = 4 and, y-intercept c = 0
Hence, one point on the graph can be taken as (0,0).
Now,
$m=\dfrac{\text{coefficient of x }}{\text{coefficient of y } }$
Hence, we move up 1 (coefficient of y) points and then move to the right 4 (coefficient of x) points.
Thus, the second point is (0 + 1, 0 + 4) = (1, 4).
Now, we plot the two points and join them and we have our line.
Note: In this question, we only need to know how to get the points for the graph and then, how to plot the points on the graph. Then we just calculate the values from the equation, plot them on the graph, join the points on the graph and we get the line which marks the required equation.
Recently Updated Pages
Basicity of sulphurous acid and sulphuric acid are
Master Class 12 Economics: Engaging Questions & Answers for Success
Master Class 12 Biology: Engaging Questions & Answers for Success
Master Class 11 English: Engaging Questions & Answers for Success
Master Class 11 Physics: Engaging Questions & Answers for Success
Master Class 11 Computer Science: Engaging Questions & Answers for Success
Trending doubts
Explain the Treaty of Vienna of 1815 class 10 social science CBSE
If a Minister of a State wants to resign to whom he class 10 social science CBSE
Why is there a time difference of about 5 hours between class 10 social science CBSE
10 examples of evaporation in daily life with explanations
What is the full form of POSCO class 10 social science CBSE
Democracy is a government of the people by the people class 10 social science CBSE