


How do you graph $y = 3x - 7?$
Answer
597k+ views
Hint: Whenever they ask us to draw a graph for a straight line equation we need to have a minimum of two points, it may be intercept points or any other point. We can get the points by substituting or assuming different values for $x$ and finding the corresponding values of $y$. By using these points we can plot the graph for the given equation.
Complete step by step answer:
The given equation $y = 3x - 7$ is a straight line equation, where we need to have a minimum of two points to plot a graph. The two points may be intercepts that are x-intercept and y-intercept which means x-intercept is a point that passes the x-axis at $y = 0$ and the y-intercept is a point that passes the y-axis at $x = 0$. We can also find the point by taking different values for $x$ and finding the corresponding values of $y$ by substituting them back in the equation.
Now, we find the y-intercept by putting $x = 0$ in the equation $y = 3x - 7$
Therefore we get, $y = 3 \times 0 - 7$
$ \Rightarrow y = - 7$ at $x = 0$
Now, we find the x-intercept by putting $y = 0$ in the equation $y = 3x - 7$
Therefore we get, $0 = 3x - 7$
$ \Rightarrow 3x = 7$
$ \Rightarrow x = \dfrac{7}{3} = 2.333$ at $y = 0$
For better understanding, we take some more points for $x$ and find the corresponding values of $y$.
Let us substitute $x = 1$ in the equation $y = 3x - 7$, we get
$y = 3 \times 1 - 7$
$ \Rightarrow y = 3 - 7 = - 4$
Now, substitute $x = 2$ in the equation $y = 3x - 7$, we get
$y = 3 \times 2 - 7$
$ \Rightarrow y = 6 - 7 = - 1$
Now, substitute $x = 3$ in the equation $y = 3x - 7$, we get
$y = 3 \times 3 - 7$
$ \Rightarrow y = 9 - 7 = 2$
So now we have points that are enough to draw a graph.
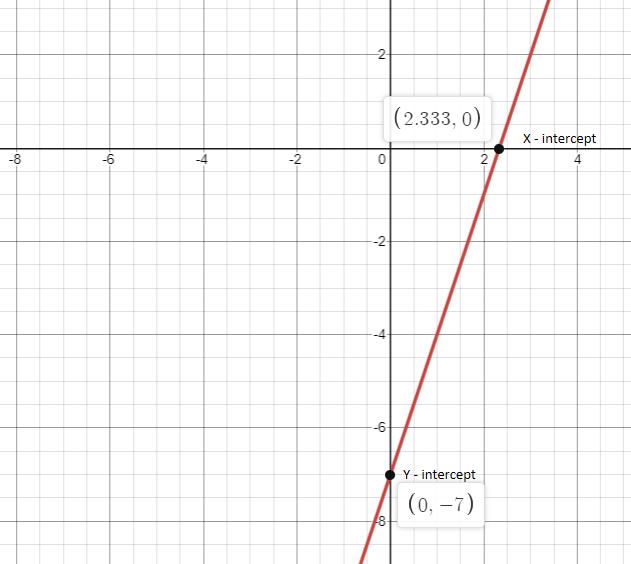
Plot the graph for the points, $(0, - 7)$ , $\left( {\dfrac{7}{3},0} \right)$ , $(1, - 4)$ , $(2, - 1)$ and $(3,2)$ .
The graph for the above points is as shown below:
Note:
Whenever they ask us to draw a graph by giving an equation, then just assume values for one unknown that is $x$ and find the corresponding values of another unknown that is $y$. Plot the same on a graph sheet. We require a minimum of two points to draw a graph but for your understanding try to take some more points and draw the graph as per the points.
Complete step by step answer:
The given equation $y = 3x - 7$ is a straight line equation, where we need to have a minimum of two points to plot a graph. The two points may be intercepts that are x-intercept and y-intercept which means x-intercept is a point that passes the x-axis at $y = 0$ and the y-intercept is a point that passes the y-axis at $x = 0$. We can also find the point by taking different values for $x$ and finding the corresponding values of $y$ by substituting them back in the equation.
Now, we find the y-intercept by putting $x = 0$ in the equation $y = 3x - 7$
Therefore we get, $y = 3 \times 0 - 7$
$ \Rightarrow y = - 7$ at $x = 0$
Now, we find the x-intercept by putting $y = 0$ in the equation $y = 3x - 7$
Therefore we get, $0 = 3x - 7$
$ \Rightarrow 3x = 7$
$ \Rightarrow x = \dfrac{7}{3} = 2.333$ at $y = 0$
For better understanding, we take some more points for $x$ and find the corresponding values of $y$.
Let us substitute $x = 1$ in the equation $y = 3x - 7$, we get
$y = 3 \times 1 - 7$
$ \Rightarrow y = 3 - 7 = - 4$
Now, substitute $x = 2$ in the equation $y = 3x - 7$, we get
$y = 3 \times 2 - 7$
$ \Rightarrow y = 6 - 7 = - 1$
Now, substitute $x = 3$ in the equation $y = 3x - 7$, we get
$y = 3 \times 3 - 7$
$ \Rightarrow y = 9 - 7 = 2$
So now we have points that are enough to draw a graph.
Plot the graph for the points, $(0, - 7)$ , $\left( {\dfrac{7}{3},0} \right)$ , $(1, - 4)$ , $(2, - 1)$ and $(3,2)$ .
The graph for the above points is as shown below:
Note:
Whenever they ask us to draw a graph by giving an equation, then just assume values for one unknown that is $x$ and find the corresponding values of another unknown that is $y$. Plot the same on a graph sheet. We require a minimum of two points to draw a graph but for your understanding try to take some more points and draw the graph as per the points.
Recently Updated Pages
Master Class 11 English: Engaging Questions & Answers for Success
Master Class 11 Social Science: Engaging Questions & Answers for Success
Master Class 11 Maths: Engaging Questions & Answers for Success
Master Class 11 Biology: Engaging Questions & Answers for Success
Master Class 11 Physics: Engaging Questions & Answers for Success
Master Class 11 Chemistry: Engaging Questions & Answers for Success
Trending doubts
One Metric ton is equal to kg A 10000 B 1000 C 100 class 11 physics CBSE
Difference Between Prokaryotic Cells and Eukaryotic Cells
Find the value of the expression given below sin 30circ class 11 maths CBSE
Difference between physical and chemical change class 11 chemistry CBSE
Two of the body parts which do not appear in MRI are class 11 biology CBSE
Draw a diagram of a plant cell and label at least eight class 11 biology CBSE