


How do you graph $y = - 3x - 3$ ?
Answer
575.7k+ views
Hint: In this question, we need to plot a graph of the given equation. We do this by finding the intercepts for the given equation. Note that the given equation is an equation of a straight line. To find the intercepts, we set one variable to zero and obtain the other variable and vice versa. Firstly, to obtain the $x$-intercept, we set the value of y equal to zero and find the point. Then, to obtain the $y$-intercept, we set the value of x equal to zero and find the point. Then from obtained $(x,y)$ points we plot a graph of the given equation in the x-y plane.
Complete step by step solution:
Given an equation of the form $y = - 3x - 3$ …… (1)
We are asked to draw the graph of the above equation.
In this problem, to plot the graph by finding the intercepts.
Note that the given equation is one of the equation of a straight line. We know this fact because both x and y terms in the equation are of power 1 (so they are not squared or square rooted terms).
We find the points of intercepts and the draw a line through them.
Finding the $x$-intercept :
The line crosses the x-axis at $y = 0$.
Taking $y = 0$ in the equation (1) we get,
$ \Rightarrow 0 = - 3x - 3$
This can be written as,
$ \Rightarrow - 3x - 3 = 0$
Adding 3 on both sides, we get,
$ \Rightarrow - 3x - 3 + 3 = 0 + 3$
Combining the like terms $ - 3 + 3 = 0$
Hence we get,
$ \Rightarrow - 3x + 0 = 3$
$ \Rightarrow - 3x = 3$
Dividing throughout by 3, we get,
$ \Rightarrow \dfrac{{ - 3x}}{3} = \dfrac{3}{3}$
$ \Rightarrow - x = 1$
$ \Rightarrow x = - 1$
So the point is $( - 1,0)$.
Finding the $y$-intercept :
The line crosses the y-axis at $x = 0$.
Taking $x = 0$ in the equation (1) we get,
$ \Rightarrow y = - 3(0) - 3$
This can be written as,
$ \Rightarrow y = 0 - 3$
$ \Rightarrow y = - 3$
So the point is $(0, - 3)$.
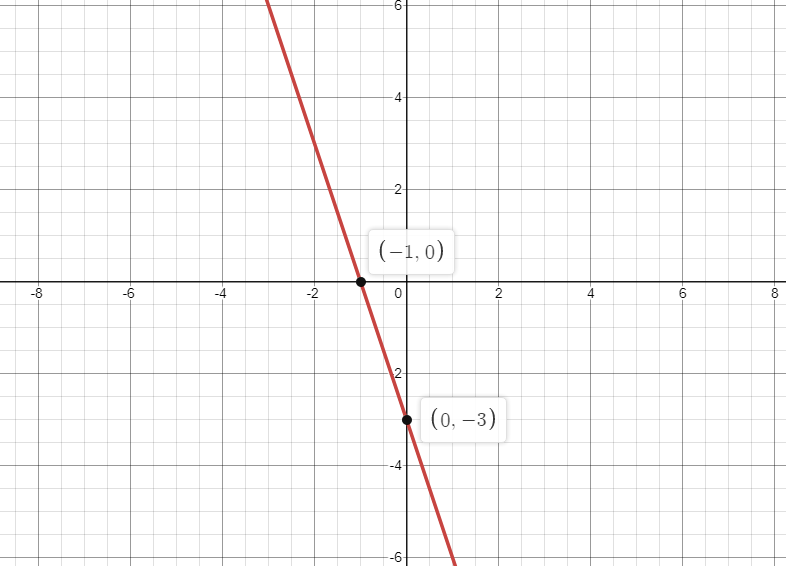
Hence the $x$-intercept is $( - 1,0)$ and the $y$-intercept is $(0, - 3)$.
Now we plot the graph for the obtained points in the x-y plane.
Note that the graph is a straight line.
Note: Students must remember that to obtain the $x$-intercept, we set the value of y equal to zero and find the point. Then, to obtain the $y$-intercept, we set the value of x equal to zero and find the point. Then from obtained $(x, y) $ points we plot a graph of the given equation in the x-y plane.
Linear graphs have many applications. In our day-to-day life, we observe variation in the value of different quantities depending upon the variation in values of other quantities.
For example, if the number of persons visiting a cloth shop increases, then the earning of the shop also increases and vice versa.
Another example, if a number of people are employed, then the time taken to accomplish a job decreases.
Complete step by step solution:
Given an equation of the form $y = - 3x - 3$ …… (1)
We are asked to draw the graph of the above equation.
In this problem, to plot the graph by finding the intercepts.
Note that the given equation is one of the equation of a straight line. We know this fact because both x and y terms in the equation are of power 1 (so they are not squared or square rooted terms).
We find the points of intercepts and the draw a line through them.
Finding the $x$-intercept :
The line crosses the x-axis at $y = 0$.
Taking $y = 0$ in the equation (1) we get,
$ \Rightarrow 0 = - 3x - 3$
This can be written as,
$ \Rightarrow - 3x - 3 = 0$
Adding 3 on both sides, we get,
$ \Rightarrow - 3x - 3 + 3 = 0 + 3$
Combining the like terms $ - 3 + 3 = 0$
Hence we get,
$ \Rightarrow - 3x + 0 = 3$
$ \Rightarrow - 3x = 3$
Dividing throughout by 3, we get,
$ \Rightarrow \dfrac{{ - 3x}}{3} = \dfrac{3}{3}$
$ \Rightarrow - x = 1$
$ \Rightarrow x = - 1$
So the point is $( - 1,0)$.
Finding the $y$-intercept :
The line crosses the y-axis at $x = 0$.
Taking $x = 0$ in the equation (1) we get,
$ \Rightarrow y = - 3(0) - 3$
This can be written as,
$ \Rightarrow y = 0 - 3$
$ \Rightarrow y = - 3$
So the point is $(0, - 3)$.
Hence the $x$-intercept is $( - 1,0)$ and the $y$-intercept is $(0, - 3)$.
Now we plot the graph for the obtained points in the x-y plane.
Note that the graph is a straight line.
Note: Students must remember that to obtain the $x$-intercept, we set the value of y equal to zero and find the point. Then, to obtain the $y$-intercept, we set the value of x equal to zero and find the point. Then from obtained $(x, y) $ points we plot a graph of the given equation in the x-y plane.
Linear graphs have many applications. In our day-to-day life, we observe variation in the value of different quantities depending upon the variation in values of other quantities.
For example, if the number of persons visiting a cloth shop increases, then the earning of the shop also increases and vice versa.
Another example, if a number of people are employed, then the time taken to accomplish a job decreases.

Recently Updated Pages
Master Class 12 Economics: Engaging Questions & Answers for Success
Master Class 12 English: Engaging Questions & Answers for Success
Master Class 12 Social Science: Engaging Questions & Answers for Success
Master Class 12 Maths: Engaging Questions & Answers for Success
Master Class 12 Physics: Engaging Questions & Answers for Success
Master Class 9 General Knowledge: Engaging Questions & Answers for Success
Trending doubts
Find the sum of series 1 + 2 + 3 + 4 + 5 + + 100 class 9 maths CBSE
Difference Between Plant Cell and Animal Cell
Fill the blanks with the suitable prepositions 1 The class 9 english CBSE
What is pollution? How many types of pollution? Define it
What is the Full Form of ICSE / ISC ?
Name 10 Living and Non living things class 9 biology CBSE