


How do you graph $ y = 3\sin 4x $ ?
Answer
574.2k+ views
Hint: In this question, we are given a sine function and we have to plot its graph. For plotting the graph of any function, we have to first convert the function to the standard form, and then we compare the given function with its standard equation. The standard form of the sine equation is $ y = A\sin (Bx + C) + D $ . On comparing the two equations, we can find out how the graph should be plotted.
Complete step-by-step answer:
We are given that $ y = 3\sin 4x $ and we know that the standard form is $ y = A\sin (Bx + C) + D $ ,
Comparing these two equations, we get –
$ A = 3,\,B = 4,\,C = 0\,and\,D = 0 $
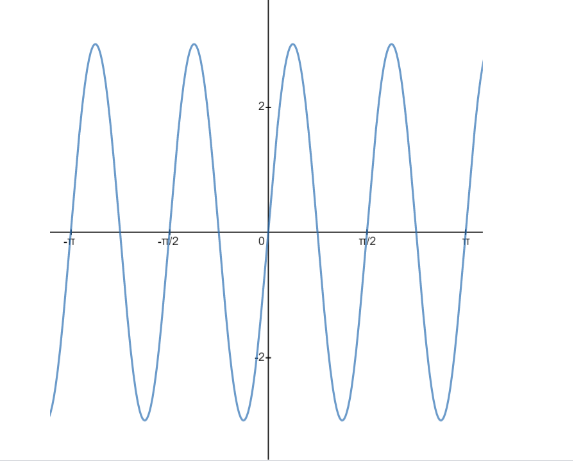
Amplitude of the given sine function is 3, so the given sine function has peak values at 3 and -3, that is, it oscillates between 3 and -3 and the given sine function completes four oscillations between 0 and $ 2\pi $ , but for plotting the graph, we have to find out the period of the function. Period of a sine function is –
$
p = \dfrac{{2\pi }}{B} \\
\Rightarrow p = \dfrac{{2\pi }}{4} = \dfrac{\pi }{2} \;
$
That is the given function repeats the oscillation after every $ \dfrac{\pi }{2} $ radians, it completes 1 oscillation in the interval 0 to $ \dfrac{\pi }{2} $ .
Now, we know all the quantities that are required for plotting the graph of the given function, so the graph of $ y = 3\sin 4x $ is plotted as follows –
Note: We know that the general form of the sine function is $ y = A\sin (Bx + C) + D $ where
A tells us the value of the peaks of the function, that is, A is the amplitude.
B tells us the number of oscillations a function does in a fixed interval, that is, B is the frequency.
C and D denote the horizontal and vertical shift of a function respectively. There is no horizontal or vertical shift in the graph of this function as the value of C and D is zero for the given function.
Complete step-by-step answer:
We are given that $ y = 3\sin 4x $ and we know that the standard form is $ y = A\sin (Bx + C) + D $ ,
Comparing these two equations, we get –
$ A = 3,\,B = 4,\,C = 0\,and\,D = 0 $
Amplitude of the given sine function is 3, so the given sine function has peak values at 3 and -3, that is, it oscillates between 3 and -3 and the given sine function completes four oscillations between 0 and $ 2\pi $ , but for plotting the graph, we have to find out the period of the function. Period of a sine function is –
$
p = \dfrac{{2\pi }}{B} \\
\Rightarrow p = \dfrac{{2\pi }}{4} = \dfrac{\pi }{2} \;
$
That is the given function repeats the oscillation after every $ \dfrac{\pi }{2} $ radians, it completes 1 oscillation in the interval 0 to $ \dfrac{\pi }{2} $ .
Now, we know all the quantities that are required for plotting the graph of the given function, so the graph of $ y = 3\sin 4x $ is plotted as follows –
Note: We know that the general form of the sine function is $ y = A\sin (Bx + C) + D $ where
A tells us the value of the peaks of the function, that is, A is the amplitude.
B tells us the number of oscillations a function does in a fixed interval, that is, B is the frequency.
C and D denote the horizontal and vertical shift of a function respectively. There is no horizontal or vertical shift in the graph of this function as the value of C and D is zero for the given function.
Recently Updated Pages
Master Class 11 Social Science: Engaging Questions & Answers for Success
Master Class 11 Chemistry: Engaging Questions & Answers for Success
Master Class 12 Business Studies: Engaging Questions & Answers for Success
Master Class 12 Chemistry: Engaging Questions & Answers for Success
Master Class 12 Biology: Engaging Questions & Answers for Success
Class 12 Question and Answer - Your Ultimate Solutions Guide
Trending doubts
One Metric ton is equal to kg A 10000 B 1000 C 100 class 11 physics CBSE
Difference Between Prokaryotic Cells and Eukaryotic Cells
How many of the following diseases can be studied with class 11 biology CBSE
Two of the body parts which do not appear in MRI are class 11 biology CBSE
Which of the following enzymes is used for carboxylation class 11 biology CBSE
Explain zero factorial class 11 maths CBSE