


How do you graph $y = 2x + 3$?
Answer
594k+ views
Hint:Plotting a graph depends on the type of equation we have. A linear equation will always give a straight line, while a quadratic equation gives a parabolic shape. In the problem we have a linear equation, so we will get a straight line in the graph. For drawing a straight line, we need to have at least two points that satisfy the given linear equation. For finding the two points which satisfy the given line we need to take two points in the coordinate system like $\left( {a,0} \right)$ and $\left( {0,b} \right)$. Now we will substitute the points in the given equation and calculate the values of $a$ and $b$. Then take a minimum of 5 points and plot the points. After plotting the points, join the points with a smooth freehand curve and identify the curve that we have obtained.
Complete step by step answer:We know that the graph of a function is the locus of points $\left( {x,y} \right)$ such that $y = f\left( x \right)$ where x, y are real numbers. We are given the following quadratic polynomial function,
$ \Rightarrow y = 2x + 3$
So, let us put $y = 0$ and find the x-intercept. We have,
$ \Rightarrow 0 = 2x + 3$
Move constant term on the other side,
$ \Rightarrow 2x = - 3$
Divide both sides by 2,
$ \Rightarrow x = - \dfrac{3}{2}$
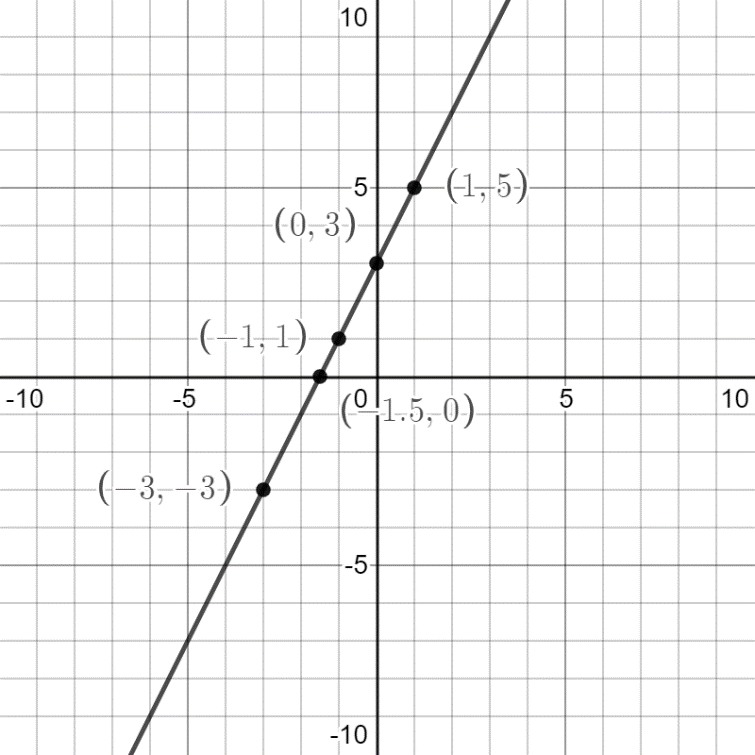
It means the curve cuts the x-axis at $\left( { - \dfrac{3}{2},0} \right)$.
Let us put $x = 0$ and find the y-intercept. We have,
$ \Rightarrow y = 2 \times 0 + 3$
Simplify the terms,
$ \Rightarrow y = 3$
It means the curve cuts the y-axis at $\left( {0,3} \right)$.
We have already two points for the equation $\left( { - \dfrac{3}{2},0} \right)$ and $\left( {0,3} \right)$. We find y for three more points.
At $x = - 3$ we have,
$ \Rightarrow y = 2 \times - 3 + 3$
Multiply the common terms,
$ \Rightarrow y = - 6 + 3$
Simplify the terms,
$ \Rightarrow y = - 3$
At $x = 1$ we have,
$ \Rightarrow y = 2 \times 1 + 3$
Multiply the common terms,
$ \Rightarrow y = 2 + 3$
Simplify the terms,
$ \Rightarrow y = 5$
At $x = - 1$ we have,
$ \Rightarrow y = 2 \times - 1 + 3$
Multiply the common terms,
$ \Rightarrow y = - 2 + 3$
Simplify the terms,
$ \Rightarrow y = 1$
So, we draw the table for x and y.
We plot the above points and join them to have the graph as
Note:
For this type of problem in which a graph of linear equations is required to draw. If the graph of the equation is not coming to a straight line then we can say that the points taken are wrong as the graph of the linear equation is always a straight line. So, if the graph through given points is a straight line and passing through them then it will be a correct sketch for the given linear equation.
Complete step by step answer:We know that the graph of a function is the locus of points $\left( {x,y} \right)$ such that $y = f\left( x \right)$ where x, y are real numbers. We are given the following quadratic polynomial function,
$ \Rightarrow y = 2x + 3$
So, let us put $y = 0$ and find the x-intercept. We have,
$ \Rightarrow 0 = 2x + 3$
Move constant term on the other side,
$ \Rightarrow 2x = - 3$
Divide both sides by 2,
$ \Rightarrow x = - \dfrac{3}{2}$
It means the curve cuts the x-axis at $\left( { - \dfrac{3}{2},0} \right)$.
Let us put $x = 0$ and find the y-intercept. We have,
$ \Rightarrow y = 2 \times 0 + 3$
Simplify the terms,
$ \Rightarrow y = 3$
It means the curve cuts the y-axis at $\left( {0,3} \right)$.
We have already two points for the equation $\left( { - \dfrac{3}{2},0} \right)$ and $\left( {0,3} \right)$. We find y for three more points.
At $x = - 3$ we have,
$ \Rightarrow y = 2 \times - 3 + 3$
Multiply the common terms,
$ \Rightarrow y = - 6 + 3$
Simplify the terms,
$ \Rightarrow y = - 3$
At $x = 1$ we have,
$ \Rightarrow y = 2 \times 1 + 3$
Multiply the common terms,
$ \Rightarrow y = 2 + 3$
Simplify the terms,
$ \Rightarrow y = 5$
At $x = - 1$ we have,
$ \Rightarrow y = 2 \times - 1 + 3$
Multiply the common terms,
$ \Rightarrow y = - 2 + 3$
Simplify the terms,
$ \Rightarrow y = 1$
So, we draw the table for x and y.
| X | 0 | $ - \dfrac{3}{2}$ | -3 | 1 | -1 |
| Y | 3 | 0 | -3 | 5 | 1 |
We plot the above points and join them to have the graph as
Note:
For this type of problem in which a graph of linear equations is required to draw. If the graph of the equation is not coming to a straight line then we can say that the points taken are wrong as the graph of the linear equation is always a straight line. So, if the graph through given points is a straight line and passing through them then it will be a correct sketch for the given linear equation.
Recently Updated Pages
Master Class 11 English: Engaging Questions & Answers for Success
Master Class 11 Social Science: Engaging Questions & Answers for Success
Master Class 11 Maths: Engaging Questions & Answers for Success
Master Class 11 Biology: Engaging Questions & Answers for Success
Master Class 11 Physics: Engaging Questions & Answers for Success
Master Class 11 Chemistry: Engaging Questions & Answers for Success
Trending doubts
One Metric ton is equal to kg A 10000 B 1000 C 100 class 11 physics CBSE
Difference Between Prokaryotic Cells and Eukaryotic Cells
Find the value of the expression given below sin 30circ class 11 maths CBSE
Two of the body parts which do not appear in MRI are class 11 biology CBSE
Draw a diagram of a plant cell and label at least eight class 11 biology CBSE
10 examples of friction in our daily life