


How do you graph $y = 2\cos 3x$?
Answer
557.1k+ views
Hint: We will write the given equation in the general format of the equation, and find the various parameters such as baseline, amplitude, and shift to plot the graph of the given equation.
Formula used:
$y = a\cos (bx + c) + d$
Where $a$ is the amplitude of the equation which tells us the maximum and the minimum value the graph would go from the baseline value,
$b$ is the period of the graph,
$c$ depicts the shift of the equation, positive shift represents that the graph is shifted towards the left and negative shift represents the graph shifting to right.
And $d$ is the baseline of the equation which tells us whether the graph is going upwards or downwards.
Complete step-by-step answer:
We have the given equation as:
$y = 2\cos 3x$, which is a cosine function which has amplitude $2$ and the period of the graph as $3$.
Since the value of $d$ is zero, we have the baseline in the graph as $0$.
Now the period of the function is found out as: $\dfrac{{2\pi }}{b}$
Therefore, on substituting the value of $b$ as $3$, we get:
$period = \dfrac{{2\pi }}{3}$
On using the scientific calculator to calculate the period, we get:
$period \approx 2.09$
Therefore, the graph of the following function can be plotted as:
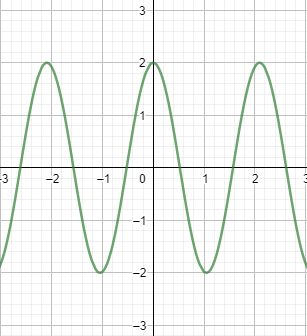
Which is the required solution for the cosine function $y = 2\cos 3x$
Note:
In this question we are using the cosine function. There also exists the sine function which is represented as: $y = a\sin (bx + c) + d$, which has the same properties that of a cosine function.
The sign of the shift $c$ represents in which direction the shift is taking place, it could be negative or positive for right and left respectively.
Formula used:
$y = a\cos (bx + c) + d$
Where $a$ is the amplitude of the equation which tells us the maximum and the minimum value the graph would go from the baseline value,
$b$ is the period of the graph,
$c$ depicts the shift of the equation, positive shift represents that the graph is shifted towards the left and negative shift represents the graph shifting to right.
And $d$ is the baseline of the equation which tells us whether the graph is going upwards or downwards.
Complete step-by-step answer:
We have the given equation as:
$y = 2\cos 3x$, which is a cosine function which has amplitude $2$ and the period of the graph as $3$.
Since the value of $d$ is zero, we have the baseline in the graph as $0$.
Now the period of the function is found out as: $\dfrac{{2\pi }}{b}$
Therefore, on substituting the value of $b$ as $3$, we get:
$period = \dfrac{{2\pi }}{3}$
On using the scientific calculator to calculate the period, we get:
$period \approx 2.09$
Therefore, the graph of the following function can be plotted as:
Which is the required solution for the cosine function $y = 2\cos 3x$
Note:
In this question we are using the cosine function. There also exists the sine function which is represented as: $y = a\sin (bx + c) + d$, which has the same properties that of a cosine function.
The sign of the shift $c$ represents in which direction the shift is taking place, it could be negative or positive for right and left respectively.
Recently Updated Pages
Master Class 11 Computer Science: Engaging Questions & Answers for Success
Master Class 11 Business Studies: Engaging Questions & Answers for Success
Master Class 11 Economics: Engaging Questions & Answers for Success
Master Class 11 English: Engaging Questions & Answers for Success
Master Class 11 Maths: Engaging Questions & Answers for Success
Master Class 11 Biology: Engaging Questions & Answers for Success
Trending doubts
One Metric ton is equal to kg A 10000 B 1000 C 100 class 11 physics CBSE
There are 720 permutations of the digits 1 2 3 4 5 class 11 maths CBSE
Discuss the various forms of bacteria class 11 biology CBSE
Draw a diagram of a plant cell and label at least eight class 11 biology CBSE
State the laws of reflection of light
Explain zero factorial class 11 maths CBSE