


How do you graph \[x>-3\]?
Answer
563.4k+ views
Hint: In the given question, we have been asked to draw a graph of the given inequality. A linear inequality is a mathematical statement that relates a linear expression as either less than or greater than another. In order to graph the given linear inequality in one variable we can use xy-plane as well as number line. In a graph we can take all the values of x that are greater than -3.
Complete step-by-step answer:
We have given that,
\[x>-3\]
It means that all the values of ‘x’ that are greater than -3.
Thus,
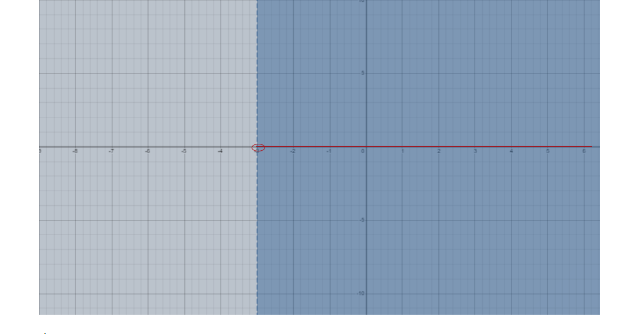
The graph of the given inequality represented above, where the open circle on -3 represents or means that -3 is not a solution of the given inequality but any value that is greater than 3 represented by the blue shaded region.
Hence, this is the required graph of x > -3.
On the number line, the inequality will be shown as;
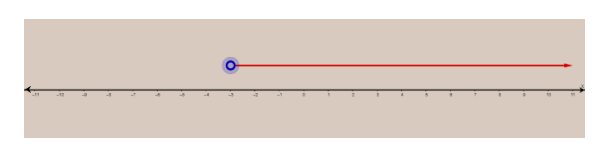
Note: While graphing the linear inequality students should remember that the solutions of inequalities can be graphed on an xy-plane and also be graphed on the number line as rays. If the inequality is "strict" we use an open dot or open circle to indicate that the endpoint of the ray is not part of the solution. For the other types of inequalities (≤ and ≥), we use closed dots or filled circles. A solution to a linear inequality is a real number that will produce a true statement when substituted for the variable. Linear inequalities have either infinitely many solutions or no solution.
Complete step-by-step answer:
We have given that,
\[x>-3\]
It means that all the values of ‘x’ that are greater than -3.
Thus,
The graph of the given inequality represented above, where the open circle on -3 represents or means that -3 is not a solution of the given inequality but any value that is greater than 3 represented by the blue shaded region.
Hence, this is the required graph of x > -3.
On the number line, the inequality will be shown as;
Note: While graphing the linear inequality students should remember that the solutions of inequalities can be graphed on an xy-plane and also be graphed on the number line as rays. If the inequality is "strict" we use an open dot or open circle to indicate that the endpoint of the ray is not part of the solution. For the other types of inequalities (≤ and ≥), we use closed dots or filled circles. A solution to a linear inequality is a real number that will produce a true statement when substituted for the variable. Linear inequalities have either infinitely many solutions or no solution.

Recently Updated Pages
Master Class 10 Computer Science: Engaging Questions & Answers for Success
Master Class 10 General Knowledge: Engaging Questions & Answers for Success
Master Class 10 English: Engaging Questions & Answers for Success
Master Class 10 Social Science: Engaging Questions & Answers for Success
Master Class 10 Maths: Engaging Questions & Answers for Success
Master Class 10 Science: Engaging Questions & Answers for Success
Trending doubts
What is BLO What is the full form of BLO class 8 social science CBSE
What are the 12 elements of nature class 8 chemistry CBSE
Name the states through which the Tropic of Cancer class 8 social science CBSE
Citizens of India can vote at the age of A 18 years class 8 social science CBSE
Advantages and disadvantages of science
Right to vote is a AFundamental Right BFundamental class 8 social science CBSE