


How do you graph $ x - y \geqslant 0 $ ?
Answer
577.2k+ views
Hint: We are given a linear equation in terms of two variables in this question and we have to plot it on the graph paper. As there are two unknown variables in the given linear equation, that is, x and y so we can find the value of one variable from the given equation by putting random values of another variable. In this question $ x - y $ is equal to zero, so we can get the plot of line easily, but we are also given that $ x - y $ is smaller than zero, so we will shade a region either below or above the line and the region will be determined by taking one random point from the graph paper that doesn’t lie on the plotted line and then we will check if that point satisfies the equation.
Complete step-by-step answer:
We are given that
$
x - y \geqslant 0 \\
\Rightarrow x \geqslant y \;
$
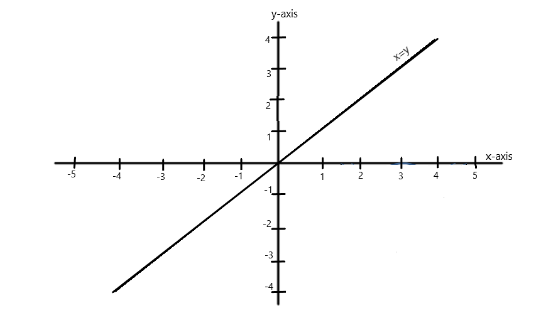
The above graph is the graph of the line $ x = y $ as at all the points lying on the line, the x-coordinate is equal to the y-coordinate.
For plotting the graph of $ x - y \geqslant 0 $ , we will check for the shaded region as follows –
At point $ (3,2) $ ,
$
x - y = 3 - 2 = 1 \\
\Rightarrow x - y \geqslant 0 \;
$
As the point satisfies the equation, we will shade the region below the line $ x = y $ that lies towards the x-axis.
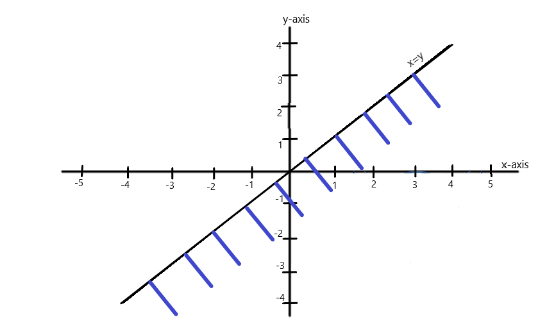
This is how we graph $ x - y \geqslant 0 $
Note: A graph is very useful for studying the relationship between two variable quantities, it contains two axes that are perpendicular to each other namely the x-axis and the y-axis. For graphing an equation, we have to find the coordinates of at least two points lying on the line, but the given line is plotted without doing so because $ x = y $ .
Complete step-by-step answer:
We are given that
$
x - y \geqslant 0 \\
\Rightarrow x \geqslant y \;
$
The above graph is the graph of the line $ x = y $ as at all the points lying on the line, the x-coordinate is equal to the y-coordinate.
For plotting the graph of $ x - y \geqslant 0 $ , we will check for the shaded region as follows –
At point $ (3,2) $ ,
$
x - y = 3 - 2 = 1 \\
\Rightarrow x - y \geqslant 0 \;
$
As the point satisfies the equation, we will shade the region below the line $ x = y $ that lies towards the x-axis.
This is how we graph $ x - y \geqslant 0 $
Note: A graph is very useful for studying the relationship between two variable quantities, it contains two axes that are perpendicular to each other namely the x-axis and the y-axis. For graphing an equation, we have to find the coordinates of at least two points lying on the line, but the given line is plotted without doing so because $ x = y $ .

Recently Updated Pages
Master Class 10 Computer Science: Engaging Questions & Answers for Success
Master Class 10 General Knowledge: Engaging Questions & Answers for Success
Master Class 10 English: Engaging Questions & Answers for Success
Master Class 10 Social Science: Engaging Questions & Answers for Success
Master Class 10 Maths: Engaging Questions & Answers for Success
Master Class 10 Science: Engaging Questions & Answers for Success
Trending doubts
What is BLO What is the full form of BLO class 8 social science CBSE
What are the 12 elements of nature class 8 chemistry CBSE
Citizens of India can vote at the age of A 18 years class 8 social science CBSE
Name the states through which the Tropic of Cancer class 8 social science CBSE
Advantages and disadvantages of science
Right to vote is a AFundamental Right BFundamental class 8 social science CBSE