


How do you graph $x - 4 = 0$?
Answer
597.3k+ views
Hint: Here we are given to plot the graph for the function which is given as $x - 4 = 0$ and therefore let us make this given function as a function where we only variable on one side and constant on other and we will get $x = 4$ and know that it represents the vertical line parallel to $y - {\text{axis}}$ and passing the point $\left( {4,0} \right)$.
Complete step by step solution:
Here we are given the function $x - 4 = 0$ which is only in one variable and therefore we can convert it into the form where we have a variable on one side and the constants on the other side. So we can take $ - 4$ from LHS to RHS and we will get:
$
x - 4 = 0 \\
x = 0 + 4 \\
x = 4 \\
$
Hence we need to actually plot the graph of $x = 4$
Whenever we have the graph of $x = a$ we just need to draw the vertical line which is passing through the point $a$ on the $x - {\text{axis}}$ and is parallel to $y - {\text{axis}}$.
Hence we will get its graph as a vertical line which is passing through the point $4$ on the $x - {\text{axis}}$ and is parallel to $y - {\text{axis}}$.
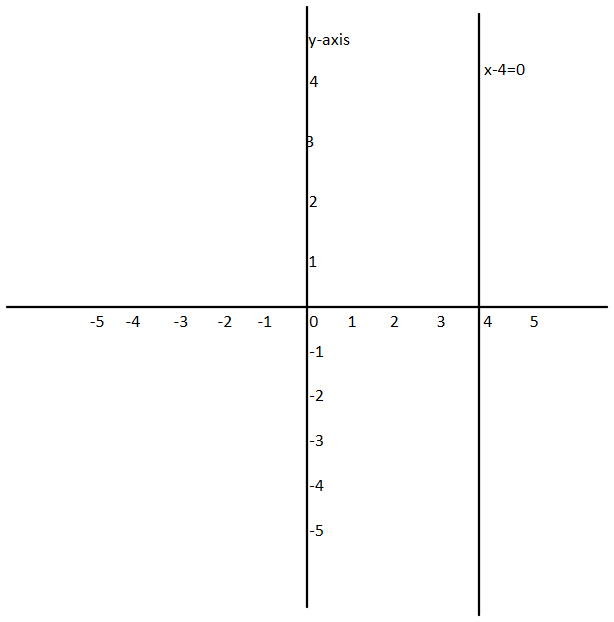
Hence here we can see that we have plotted the graph of the line which is given to us as
$x - 4 = 0$
So we can also notice that every point on the plotted line has its abscissa at $4$.
Note:
Similarly when we are given to plot the graph of the line $y = a$ then we need to plot the line which is passing through $\left( {0,a} \right)$ and parallel to $x - {\text{axis}}$ and therefore we must know the procedure to plot such graphs.
Complete step by step solution:
Here we are given the function $x - 4 = 0$ which is only in one variable and therefore we can convert it into the form where we have a variable on one side and the constants on the other side. So we can take $ - 4$ from LHS to RHS and we will get:
$
x - 4 = 0 \\
x = 0 + 4 \\
x = 4 \\
$
Hence we need to actually plot the graph of $x = 4$
Whenever we have the graph of $x = a$ we just need to draw the vertical line which is passing through the point $a$ on the $x - {\text{axis}}$ and is parallel to $y - {\text{axis}}$.
Hence we will get its graph as a vertical line which is passing through the point $4$ on the $x - {\text{axis}}$ and is parallel to $y - {\text{axis}}$.
Hence here we can see that we have plotted the graph of the line which is given to us as
$x - 4 = 0$
So we can also notice that every point on the plotted line has its abscissa at $4$.
Note:
Similarly when we are given to plot the graph of the line $y = a$ then we need to plot the line which is passing through $\left( {0,a} \right)$ and parallel to $x - {\text{axis}}$ and therefore we must know the procedure to plot such graphs.
Recently Updated Pages
Master Class 11 English: Engaging Questions & Answers for Success
Master Class 11 Social Science: Engaging Questions & Answers for Success
Master Class 11 Maths: Engaging Questions & Answers for Success
Master Class 11 Biology: Engaging Questions & Answers for Success
Master Class 11 Physics: Engaging Questions & Answers for Success
Master Class 11 Chemistry: Engaging Questions & Answers for Success
Trending doubts
One Metric ton is equal to kg A 10000 B 1000 C 100 class 11 physics CBSE
Difference Between Prokaryotic Cells and Eukaryotic Cells
Find the value of the expression given below sin 30circ class 11 maths CBSE
Difference between physical and chemical change class 11 chemistry CBSE
Two of the body parts which do not appear in MRI are class 11 biology CBSE
Draw a diagram of a plant cell and label at least eight class 11 biology CBSE