


How do you graph \[x + y = 4\]?
Answer
555.3k+ views
Hint: Here, we will substitute the different values of \[x\] in the given equation to get the corresponding values of \[y\]. From this we will get the coordinate points and using these points we will draw the required graph.
Complete step-by-step answer:
The given equation is a linear equation in two variables as it is having two variables \[x\] and \[y\].
Now, as we know that a linear equation in two variables can have infinitely many solutions.
Thus, we will write the given equation \[x + y = 4\] such that \[x\] becomes an independent and \[y\] becomes a dependent variable. This means that \[x\] can take any value whereas the value taken by \[y\] will depend on it.
Thus, the given equation can be written as:
\[y = 4 - x\]
Here, substituting \[x = 0\], we get,
\[y = 4 - 0 = 4\]
Then, substituting \[x = 2\], we get,
\[y = 4 - 2 = 2\]
And, substituting \[x = 4\], we get,
\[y = 4 - 4 = 0\]
Therefore, we can make the following table:
Hence, we will plot the points \[\left( {0,4} \right),\left( {2,2} \right),\left( {4,0} \right)\] on the graph to show the given equation.
Therefore, this is the required answer.
Note:
An equation is called linear equation in two variables if it can be written in the form of \[ax + by + c = 0\] where \[a,b,c\] are real numbers and \[a \ne 0\] , \[b \ne 0\] as they are coefficients of \[x\] and \[y\] respectively. Also, the power of linear equations in two variables will be 1 as it is a ‘linear equation’. Also, a linear equation in two variables can sometimes have infinitely many solutions rather than only one in the case of ‘one variable’. The graph of a linear equation is always a straight line.
Complete step-by-step answer:
The given equation is a linear equation in two variables as it is having two variables \[x\] and \[y\].
Now, as we know that a linear equation in two variables can have infinitely many solutions.
Thus, we will write the given equation \[x + y = 4\] such that \[x\] becomes an independent and \[y\] becomes a dependent variable. This means that \[x\] can take any value whereas the value taken by \[y\] will depend on it.
Thus, the given equation can be written as:
\[y = 4 - x\]
Here, substituting \[x = 0\], we get,
\[y = 4 - 0 = 4\]
Then, substituting \[x = 2\], we get,
\[y = 4 - 2 = 2\]
And, substituting \[x = 4\], we get,
\[y = 4 - 4 = 0\]
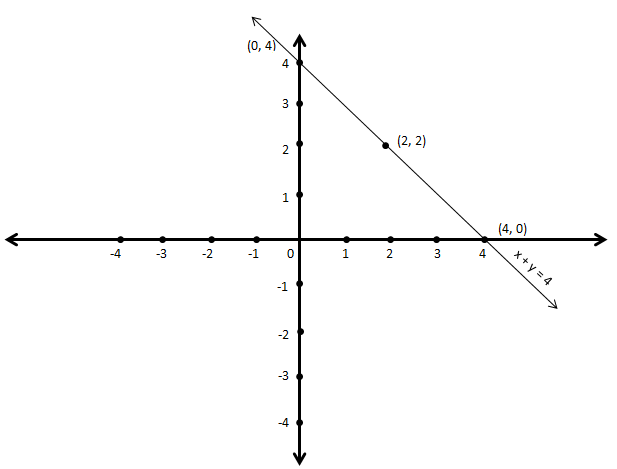
Therefore, we can make the following table:
| X | 0 | 2 | 4 |
| Y | 4 | 2 | 0 |
Hence, we will plot the points \[\left( {0,4} \right),\left( {2,2} \right),\left( {4,0} \right)\] on the graph to show the given equation.
Therefore, this is the required answer.
Note:
An equation is called linear equation in two variables if it can be written in the form of \[ax + by + c = 0\] where \[a,b,c\] are real numbers and \[a \ne 0\] , \[b \ne 0\] as they are coefficients of \[x\] and \[y\] respectively. Also, the power of linear equations in two variables will be 1 as it is a ‘linear equation’. Also, a linear equation in two variables can sometimes have infinitely many solutions rather than only one in the case of ‘one variable’. The graph of a linear equation is always a straight line.
Recently Updated Pages
Master Class 11 Computer Science: Engaging Questions & Answers for Success
Master Class 11 Business Studies: Engaging Questions & Answers for Success
Master Class 11 Economics: Engaging Questions & Answers for Success
Master Class 11 English: Engaging Questions & Answers for Success
Master Class 11 Maths: Engaging Questions & Answers for Success
Master Class 11 Biology: Engaging Questions & Answers for Success
Trending doubts
One Metric ton is equal to kg A 10000 B 1000 C 100 class 11 physics CBSE
There are 720 permutations of the digits 1 2 3 4 5 class 11 maths CBSE
Discuss the various forms of bacteria class 11 biology CBSE
Draw a diagram of a plant cell and label at least eight class 11 biology CBSE
State the laws of reflection of light
Explain zero factorial class 11 maths CBSE