


How do you graph \[x+3y=9\]?
Answer
610.8k+ views
Hint: Here, in this problem, we have to graph the given equation. So, we have to find x-intercept and y-intercept with the given equation. We already know that for x-intercept the value of y is 0 and for y-intercept the value of x is 0, using this we can find the x and y coordinates and can plot the coordinate points in the graph.
Complete step by step answer:
We know that the given equation is,
\[x+3y=9\]……… (1)
Now we have to find x-coordinate.
We know that at x-intercept, y is equal to 0, substituting y = 0 in equation (1), we get
\[\begin{align}
& \Rightarrow x+3\left( 0 \right)=9 \\
& \Rightarrow x=9 \\
\end{align}\]
Therefore, the x coordinate is \[\left( 9,0 \right)\].
Now we have to find the y-coordinate.
We know that at y-intercept, the value of x is 0, substituting x = 0 in equation (1), we get
\[\Rightarrow 0+3y=9\]
We can divide by 3 on both sides, we get
\[\begin{align}
& \Rightarrow \dfrac{3y}{3}=\dfrac{9}{3} \\
& \Rightarrow y=3 \\
\end{align}\]
Therefore, the y-coordinate is \[\left( 0,3 \right)\].
We can also find other two points to be plotted by assuming value to x and y.
We can assume for y = 1, then the value of x from equation (1) is,
\[\begin{align}
& \Rightarrow x+3\left( 1 \right)=9 \\
& \Rightarrow x=6 \\
\end{align}\]
We can assume for y = 2, then the value of x from equation (1) is,
\[\begin{align}
& \Rightarrow x+3\left( 2 \right)=9 \\
& \Rightarrow x=3 \\
\end{align}\]
Therefore, the other two points are \[\left( 6,1 \right),\left( 3,2 \right)\]
Now we can plot the x-coordinate \[\left( 9,0 \right)\], y-coordinate \[\left( 0,3 \right)\] and other points \[\left( 6,1 \right),\left( 3,2 \right)\]
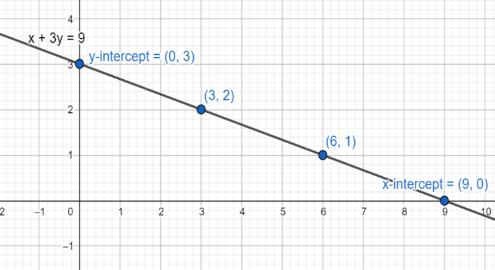
Note: Students make mistakes while finding x-intercept and y-intercept, we should always remember that, at x-intercept, the value of y is 0 and at y-intercept, the value of x is 0. We can assume any other points to find other points to be plotted in the graph.
Complete step by step answer:
We know that the given equation is,
\[x+3y=9\]……… (1)
Now we have to find x-coordinate.
We know that at x-intercept, y is equal to 0, substituting y = 0 in equation (1), we get
\[\begin{align}
& \Rightarrow x+3\left( 0 \right)=9 \\
& \Rightarrow x=9 \\
\end{align}\]
Therefore, the x coordinate is \[\left( 9,0 \right)\].
Now we have to find the y-coordinate.
We know that at y-intercept, the value of x is 0, substituting x = 0 in equation (1), we get
\[\Rightarrow 0+3y=9\]
We can divide by 3 on both sides, we get
\[\begin{align}
& \Rightarrow \dfrac{3y}{3}=\dfrac{9}{3} \\
& \Rightarrow y=3 \\
\end{align}\]
Therefore, the y-coordinate is \[\left( 0,3 \right)\].
We can also find other two points to be plotted by assuming value to x and y.
We can assume for y = 1, then the value of x from equation (1) is,
\[\begin{align}
& \Rightarrow x+3\left( 1 \right)=9 \\
& \Rightarrow x=6 \\
\end{align}\]
We can assume for y = 2, then the value of x from equation (1) is,
\[\begin{align}
& \Rightarrow x+3\left( 2 \right)=9 \\
& \Rightarrow x=3 \\
\end{align}\]
Therefore, the other two points are \[\left( 6,1 \right),\left( 3,2 \right)\]
Now we can plot the x-coordinate \[\left( 9,0 \right)\], y-coordinate \[\left( 0,3 \right)\] and other points \[\left( 6,1 \right),\left( 3,2 \right)\]
Note: Students make mistakes while finding x-intercept and y-intercept, we should always remember that, at x-intercept, the value of y is 0 and at y-intercept, the value of x is 0. We can assume any other points to find other points to be plotted in the graph.
Recently Updated Pages
Master Class 11 English: Engaging Questions & Answers for Success
Master Class 11 Physics: Engaging Questions & Answers for Success
Master Class 11 Computer Science: Engaging Questions & Answers for Success
Master Class 11 Chemistry: Engaging Questions & Answers for Success
Master Class 11 Social Science: Engaging Questions & Answers for Success
Master Class 11 Accountancy: Engaging Questions & Answers for Success
Trending doubts
Difference Between Prokaryotic Cells and Eukaryotic Cells
Two of the body parts which do not appear in MRI are class 11 biology CBSE
One Metric ton is equal to kg A 10000 B 1000 C 100 class 11 physics CBSE
10 examples of friction in our daily life
Draw a diagram of nephron and explain its structur class 11 biology CBSE
Draw a diagram of a plant cell and label at least eight class 11 biology CBSE